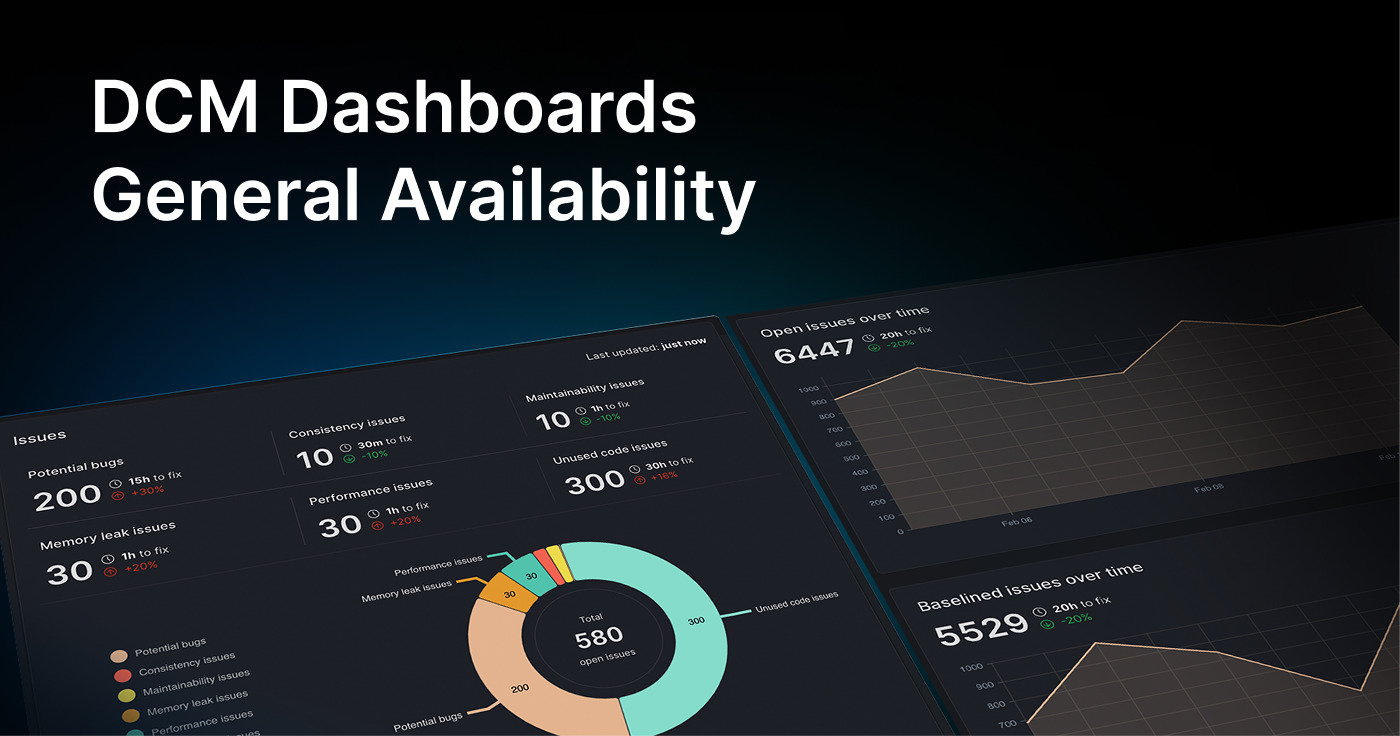
Announcing General Availability of DCM Dashboards
Two months ago, we announced DCM Dashboards (Closed Beta), a solid new way to monitor your issues, metrics, and code quality trends over time for your entire organization' projects.
Since then, we've worked closely with many of early adopters and refined the experience based on their feedback as well as adding new features and functionalities.
Today, we’re excited to announce that DCM Dashboards is now generally available to all Teams and Enterprise customers.
Your Rules, Your Metrics, Your Dashboards
DCM Dashboards provide an overview of your projects' quality and helps you quickly visualize your technical debt and how it changes over time.
Below is the quick demo:
The three main core of "DCM Dashboards" are:
- Managing Projects
- Aggregated overview and monitor and track trends and issues
- Single projects overview, monitor and tracking issues, trends and violations
In this blog, we will go through each of these and demonstrate how it works along with our comprehensive documentation that you can explore.
Managing Projects
This is s the part you can see all projects of your organization, create one, edit or delete and make it favorite to get access to it quicker.
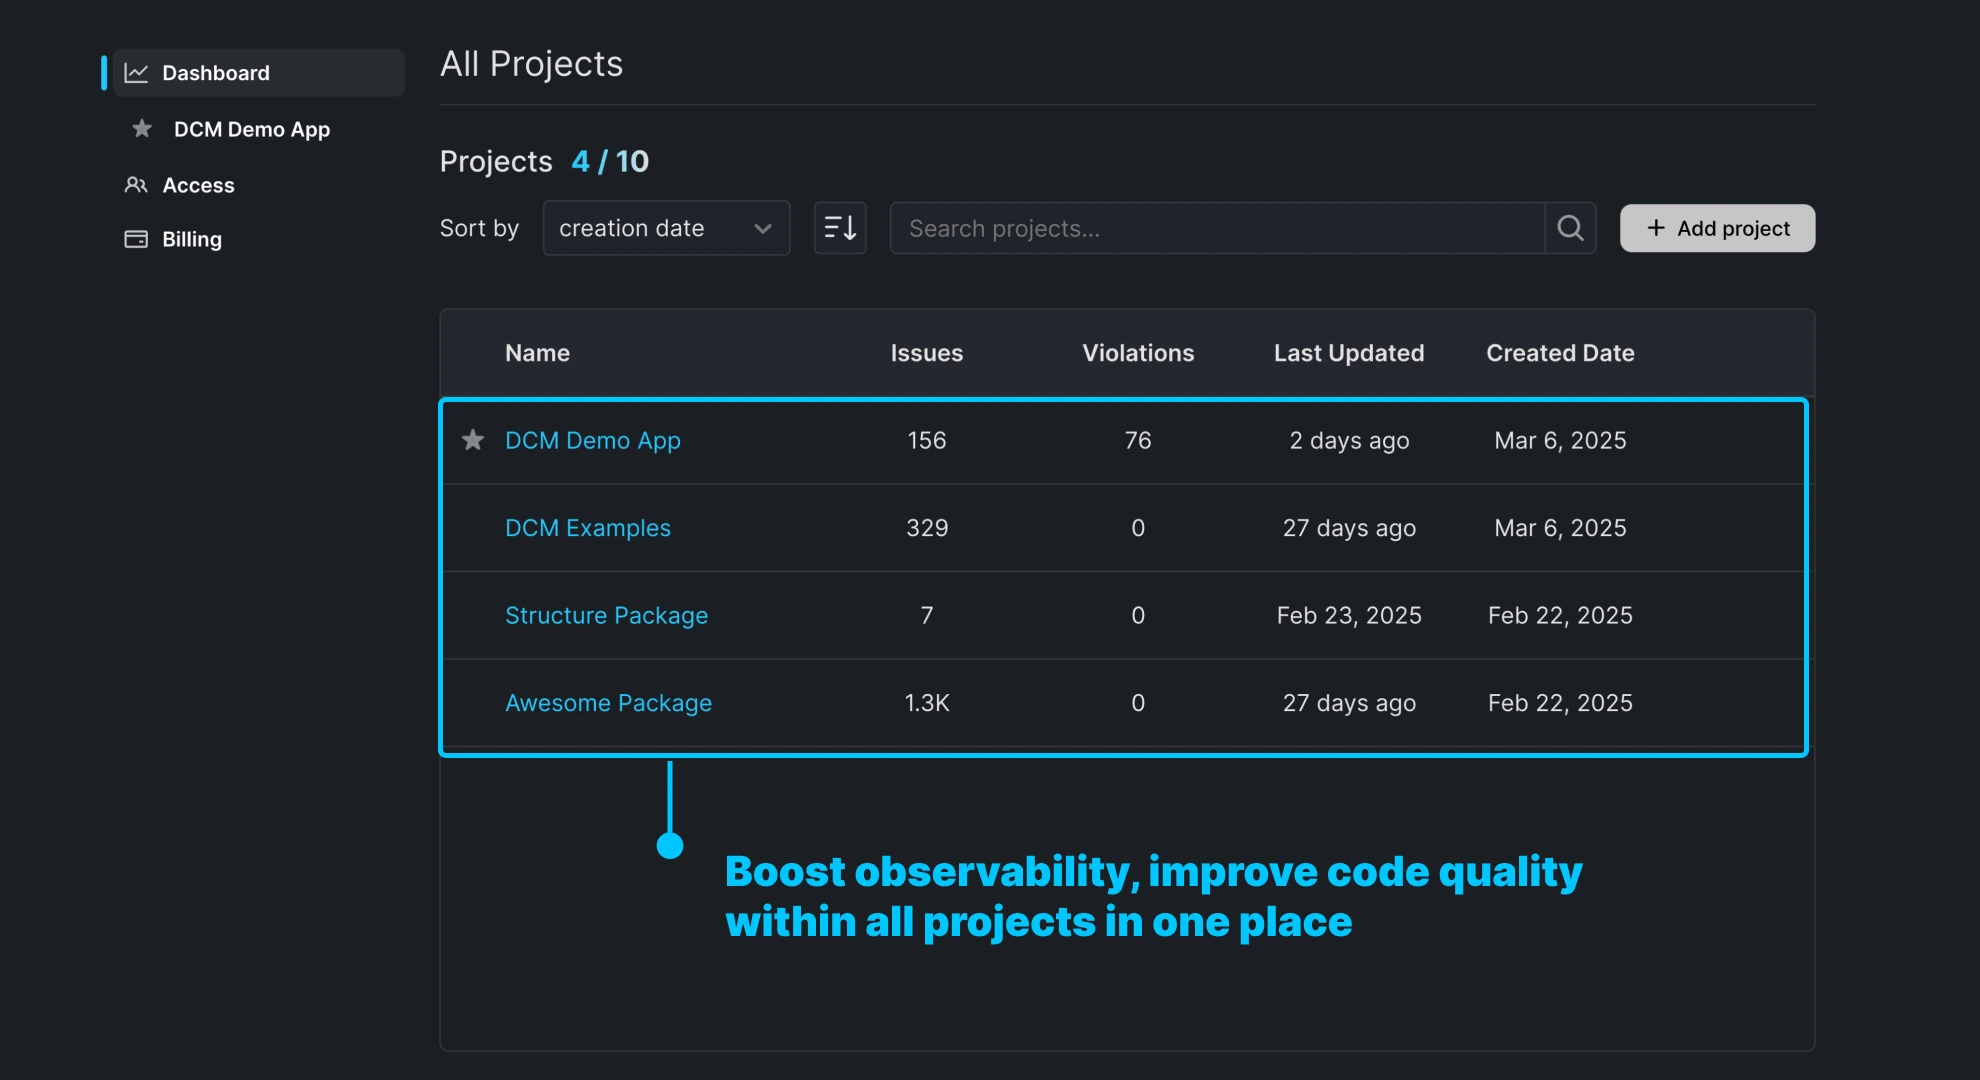
Options such as filter, sorting and search is available in case you have a long list to get access to your project faster.
To learn more about managing projects, check out our new documentation.
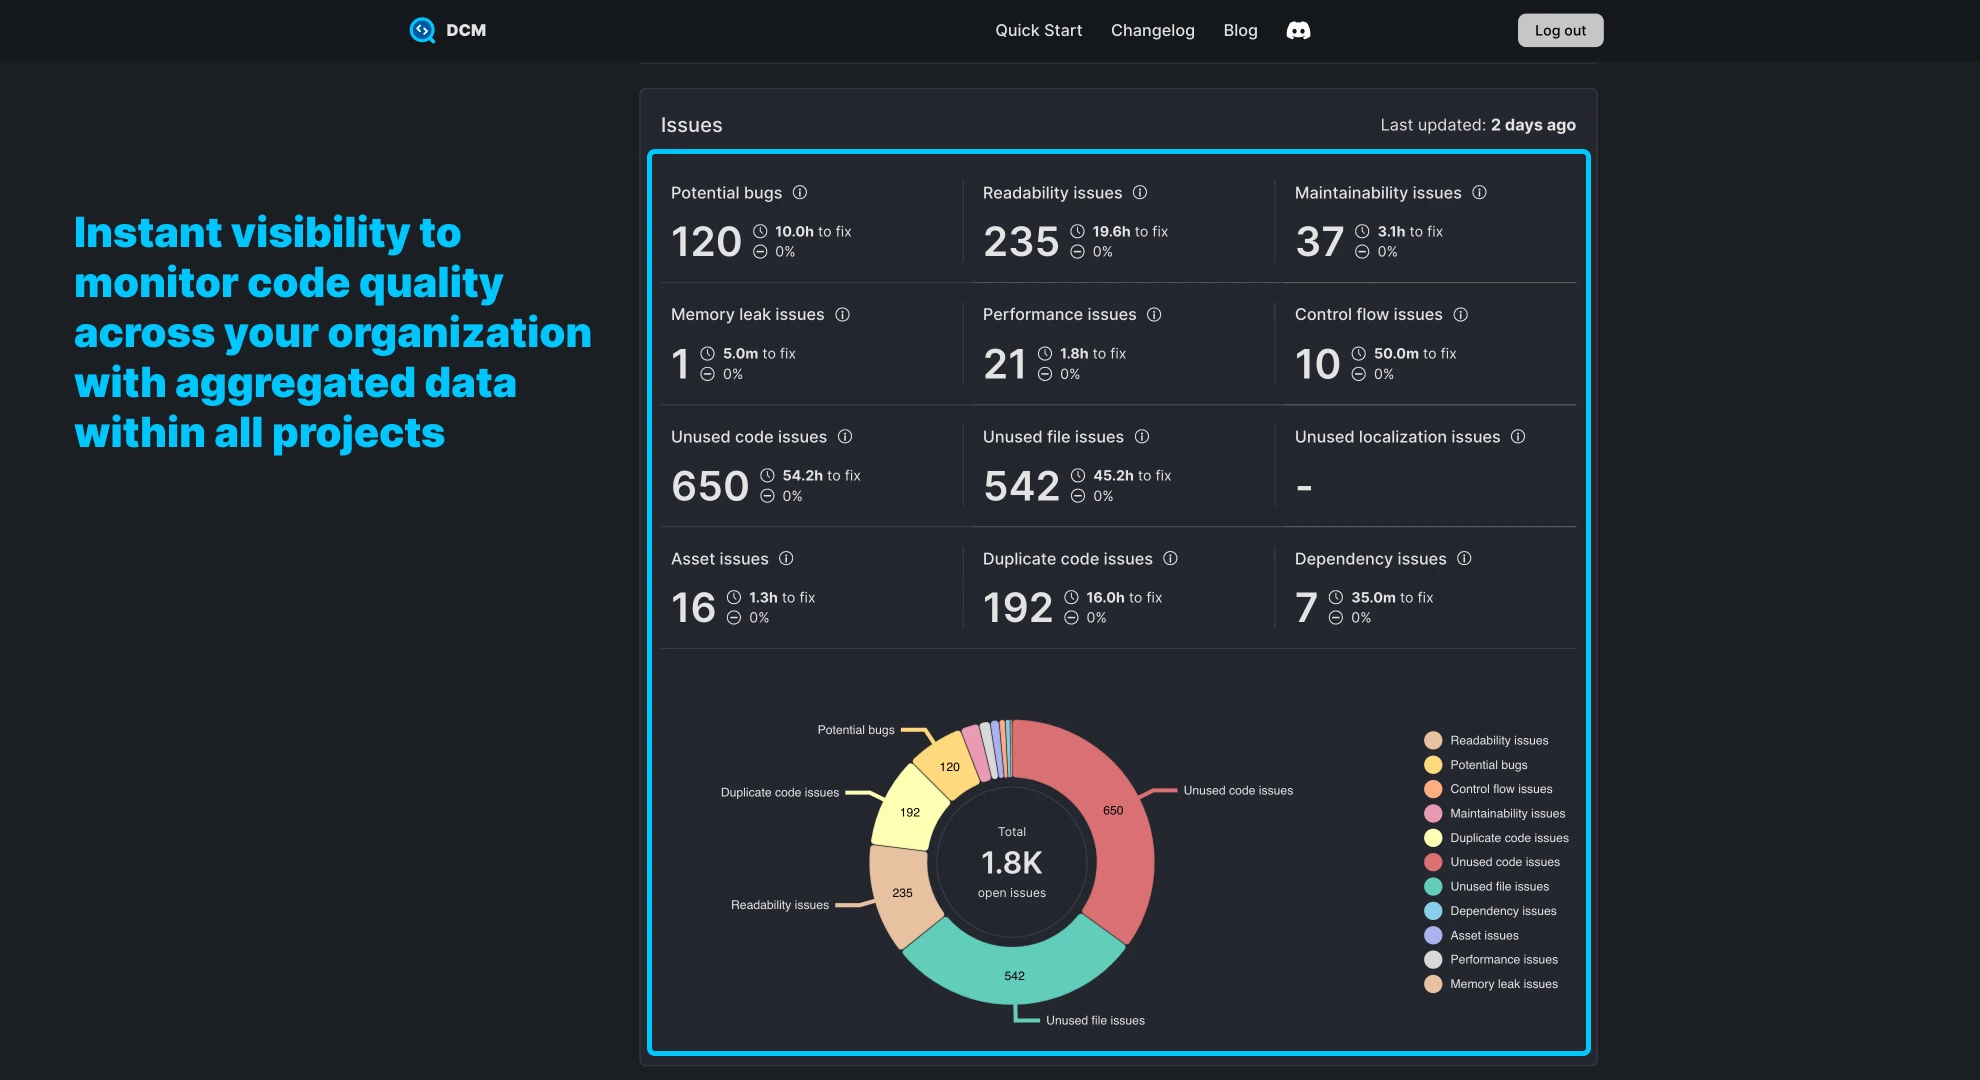
Aggregated Overview
The aggregated projects overview page gives an overall health check of your entire projects within your organization. This comes with multiple features including:
- An aggregated overview of issues from potential rule analysis and commands along with quick percentage change, over that last 30 days. This helps you to have a quick checks on code quality improvement within your organization and catch what that might have been missed.
- Historical changes which includes changes of issues, metric violations and baselined issues. Looking at the charts, you may find out the potential trends or significant changes overtime and act quickly on those in case if it was not intentional.
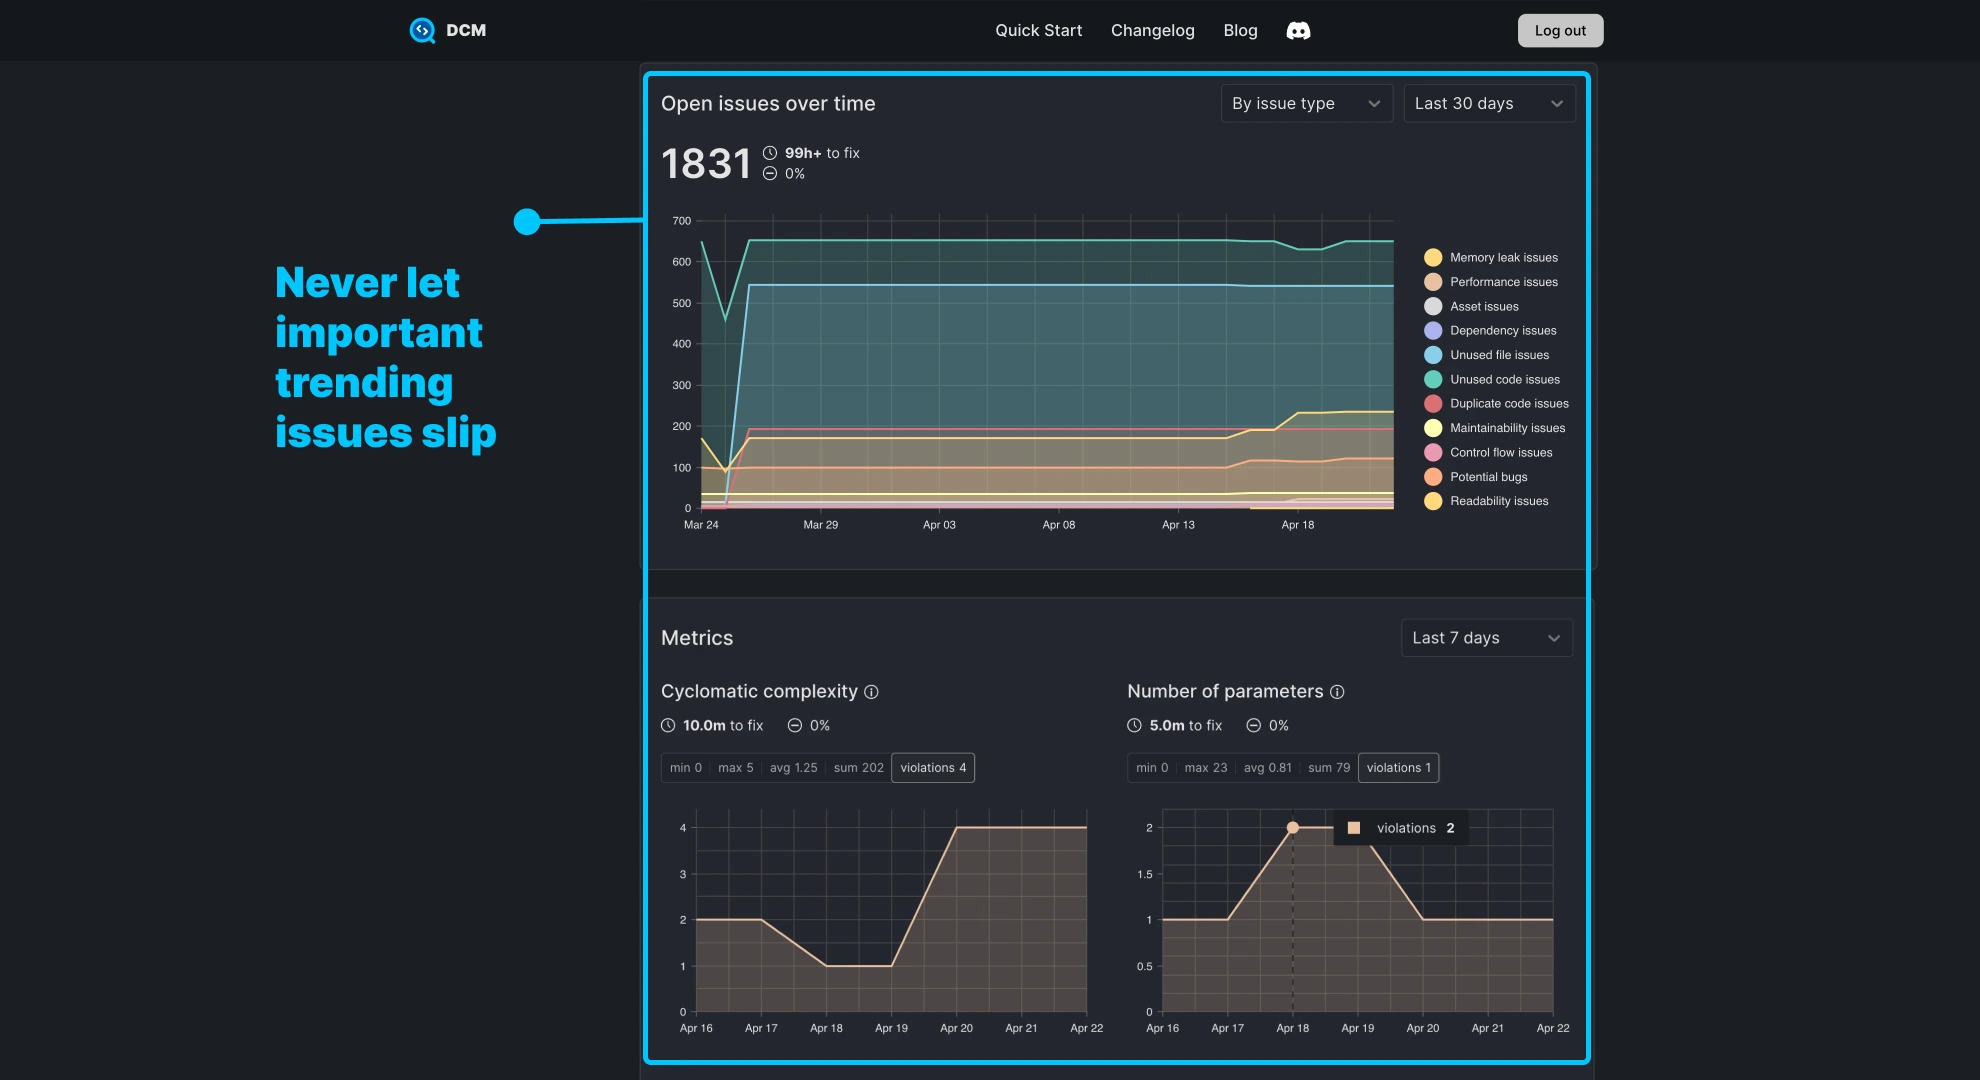
This always help you to get on top of your projects code quality and plan accordingly. Never miss issues that are introduced over time.
To learn more about projects overview, check out our new documentation.
Single Project
On the project page, you have access to 4 tabs:
- Overview
- Open Issues
- Metric Violations
- DCM Config
The overview tab is similar to projects overview page that consist of code quality overview, visualized technical debt, monitor and tracking issues and metrics over time.
The "Open Issues" tabs where you can find all uploaded issues and violations based on enabled rules and metrics. That's where you can focus on what matters most and prioritize to fix.
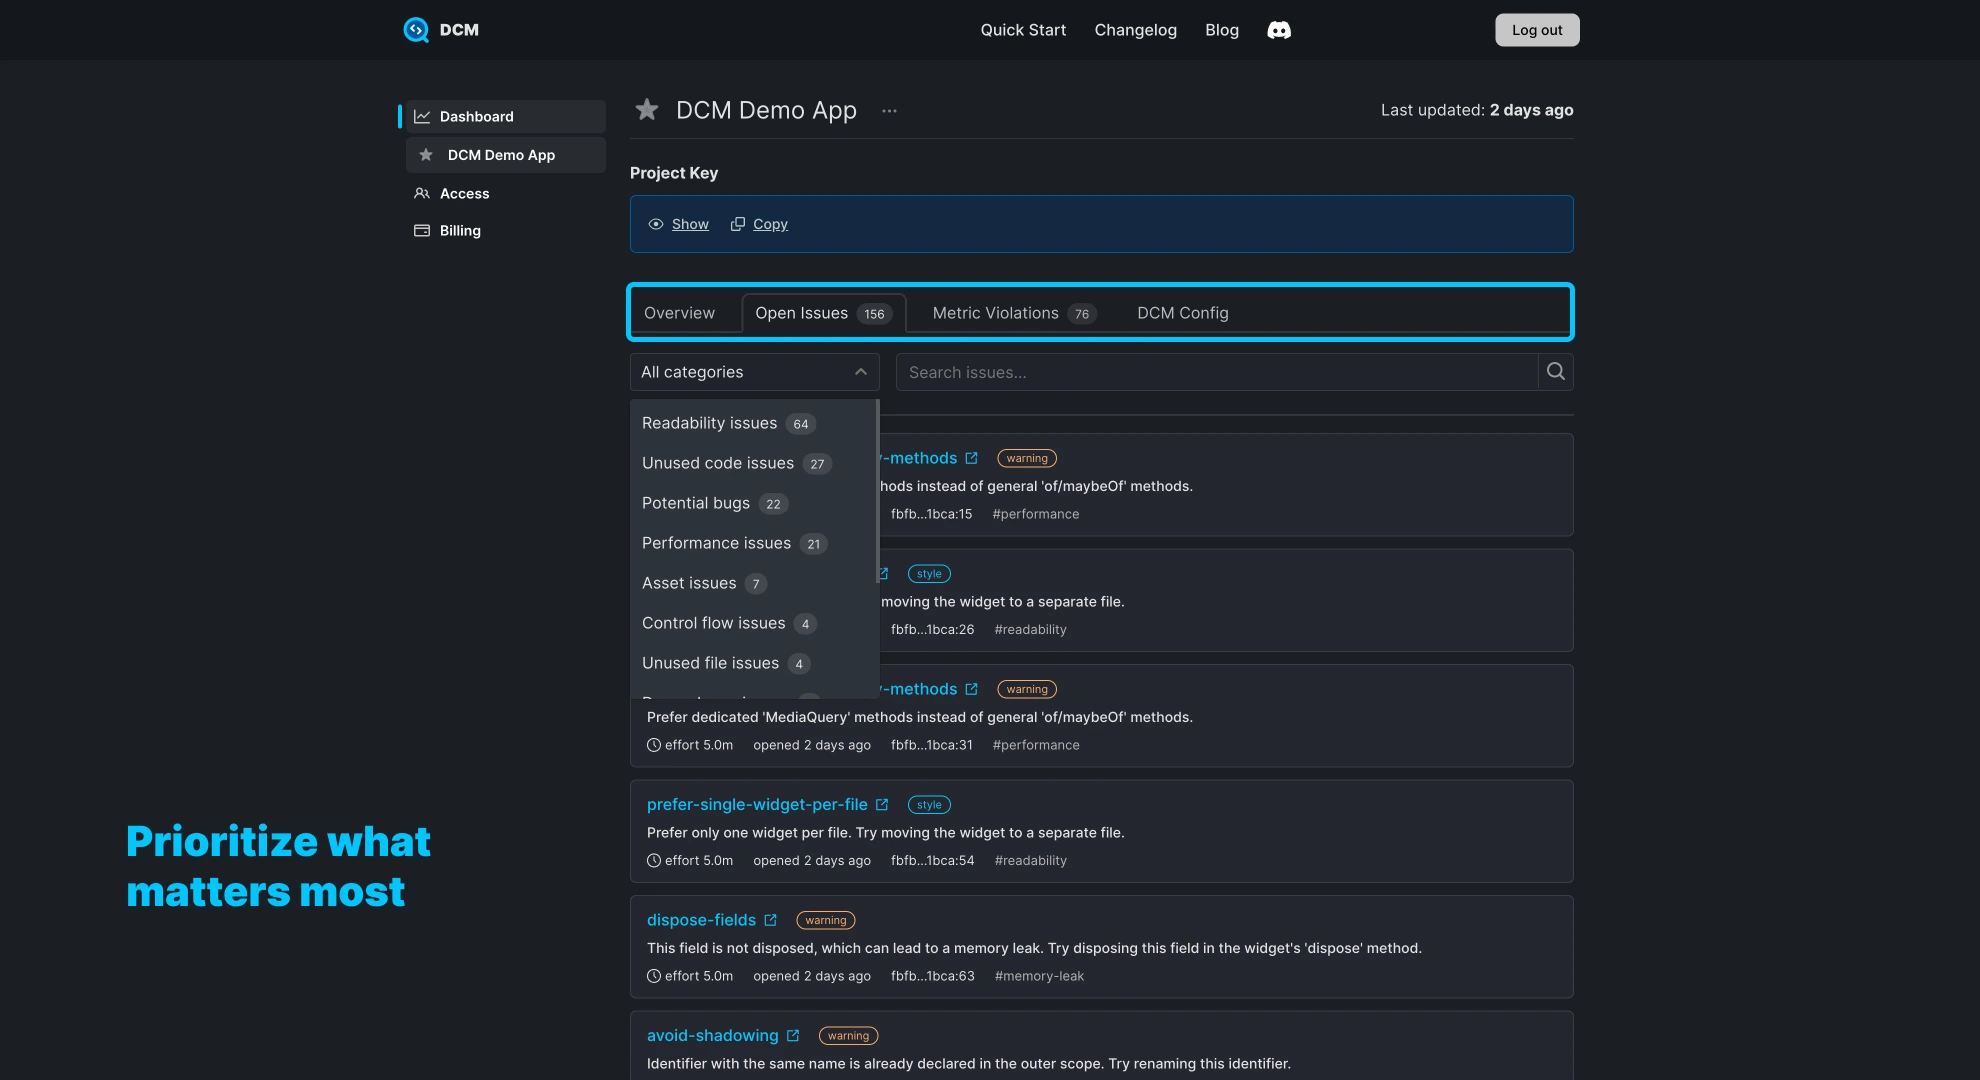
For example, you might have missed your project have memory leaks since you have not unintentionally enabled one of our memory leaks rules. With this overview, you can pick it up and plan to fix it.
Each issue comes with estimated effort to fix, tag and severity and also is clickable to show you how to fix with "bad code" vs "good code" documentation.
To learn more about single project overview, check out our new documentation.
Printable Reports
One of our exciting improvements to "DCM Dashboards" is the ability to create a printable version of the report. This helps to quickly share the report within your organization or send it to your customers.
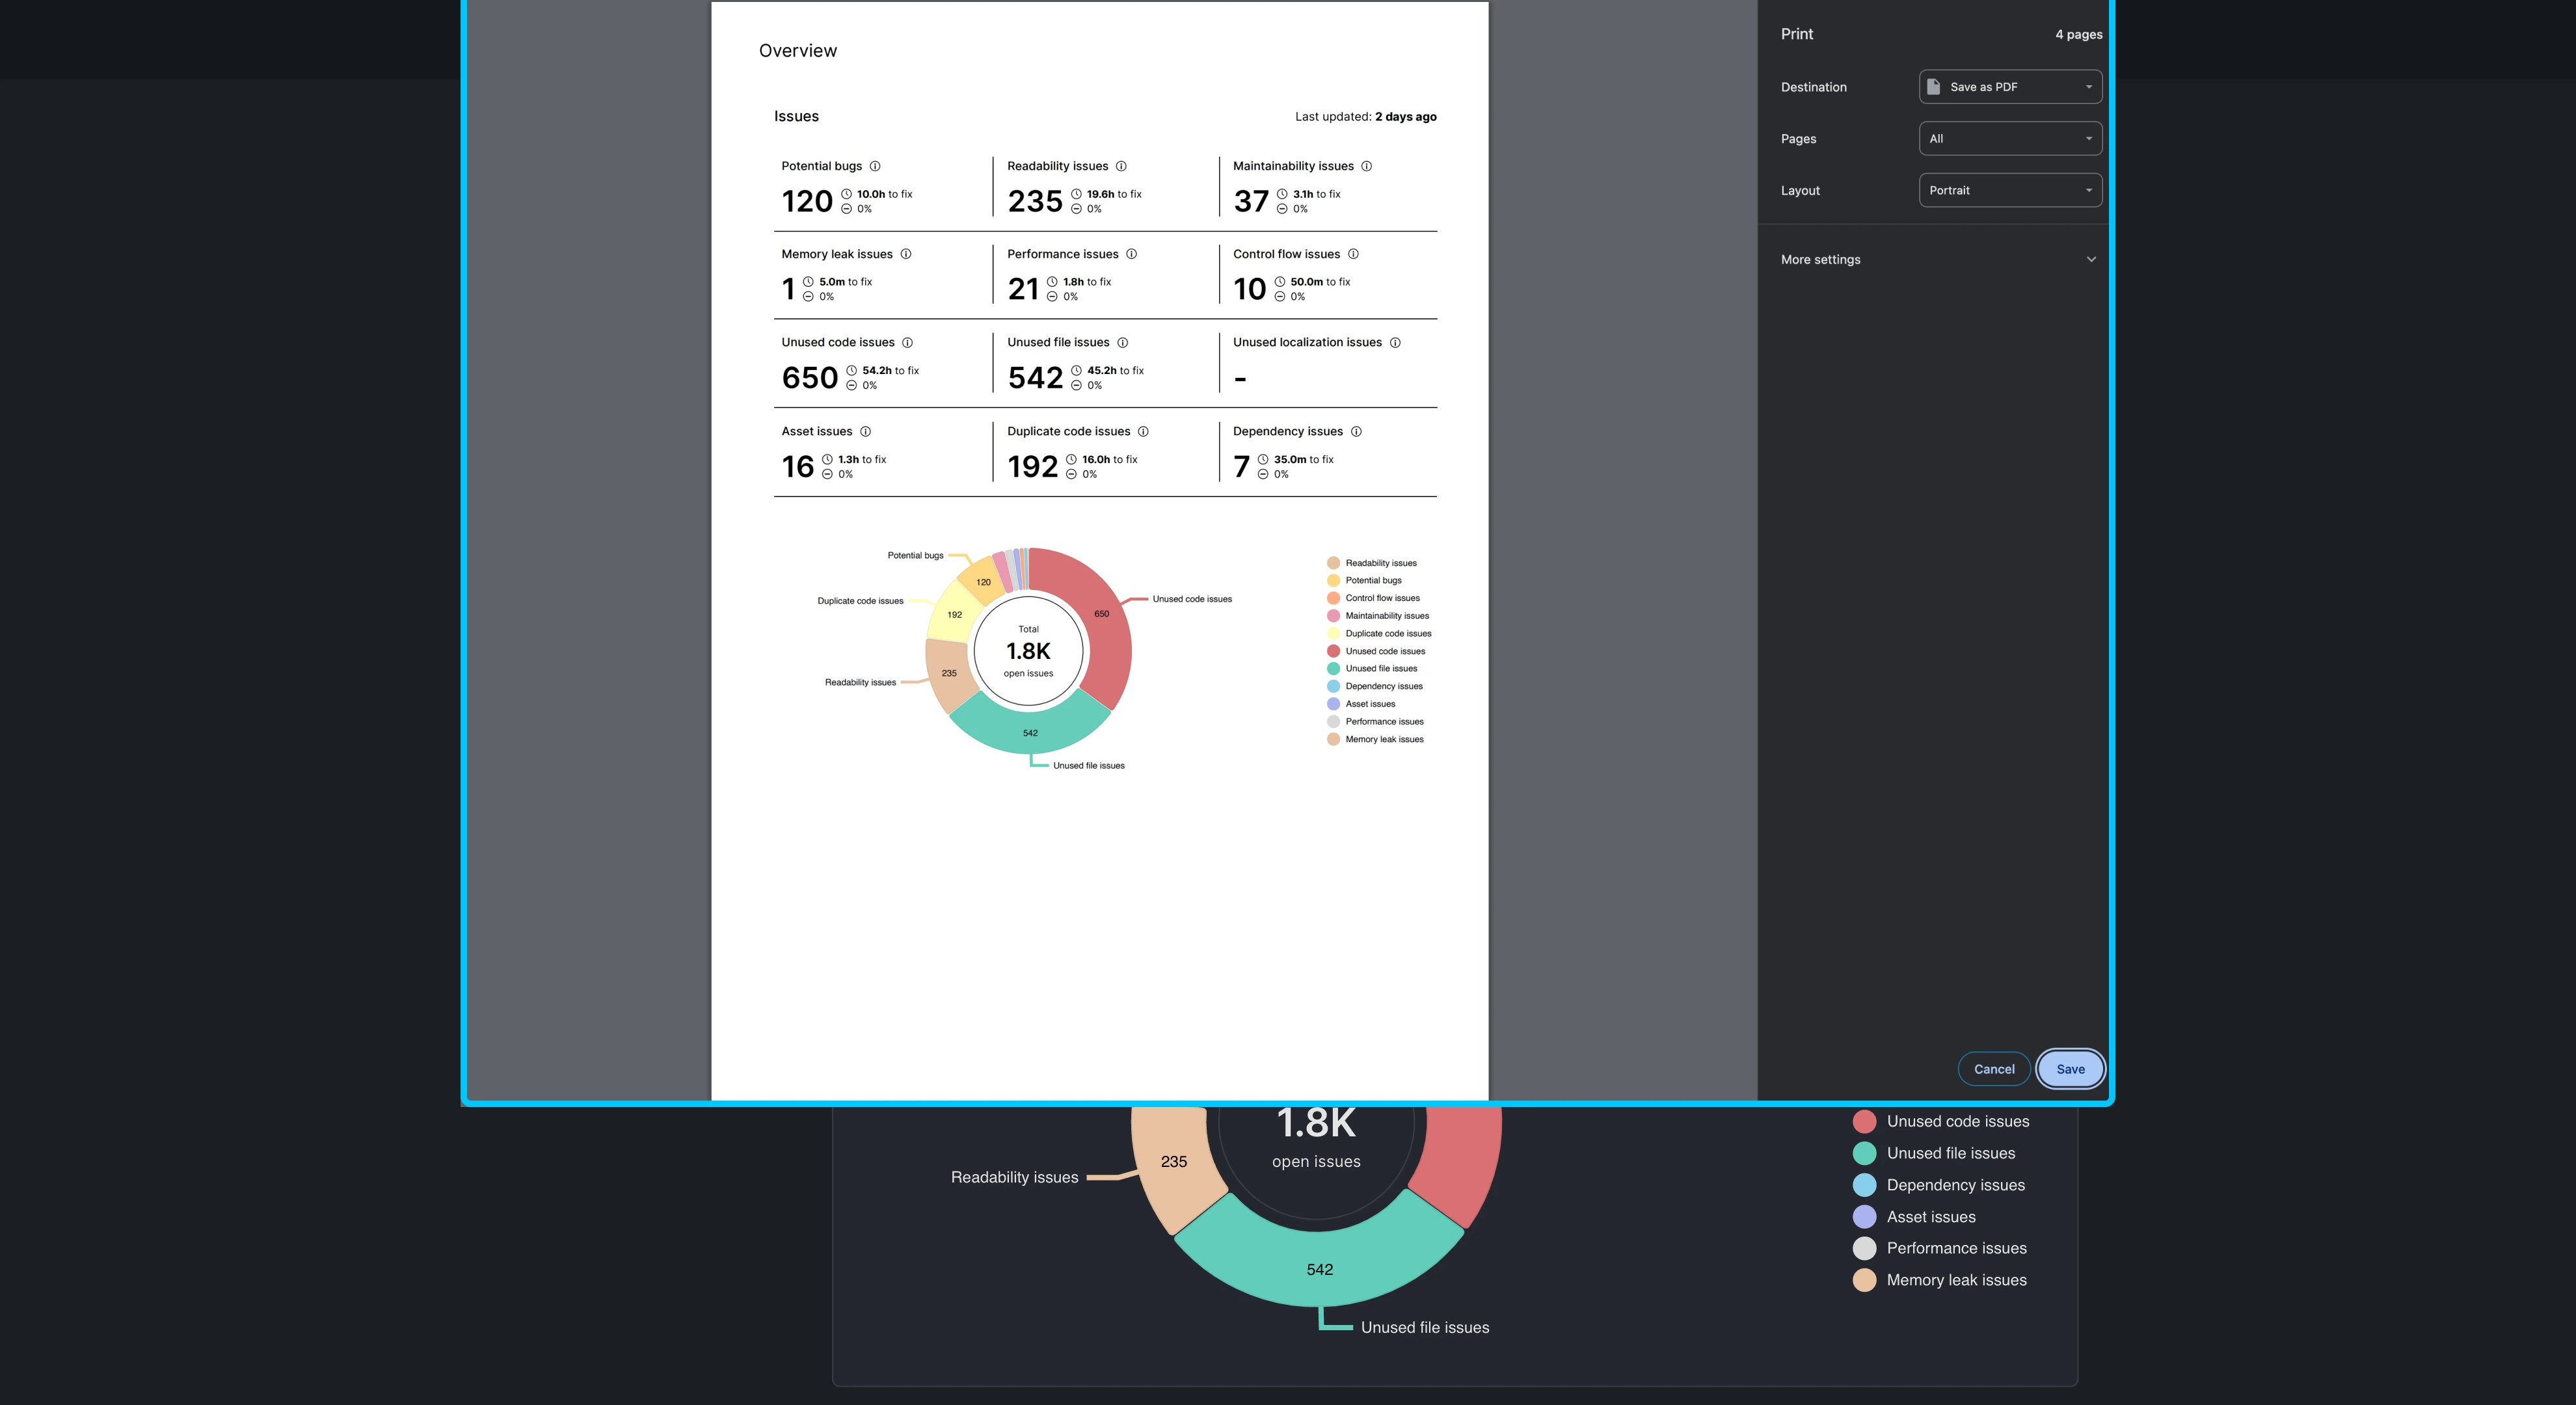
Simply print the dashboard page and you can either print or make a PDF version of it.
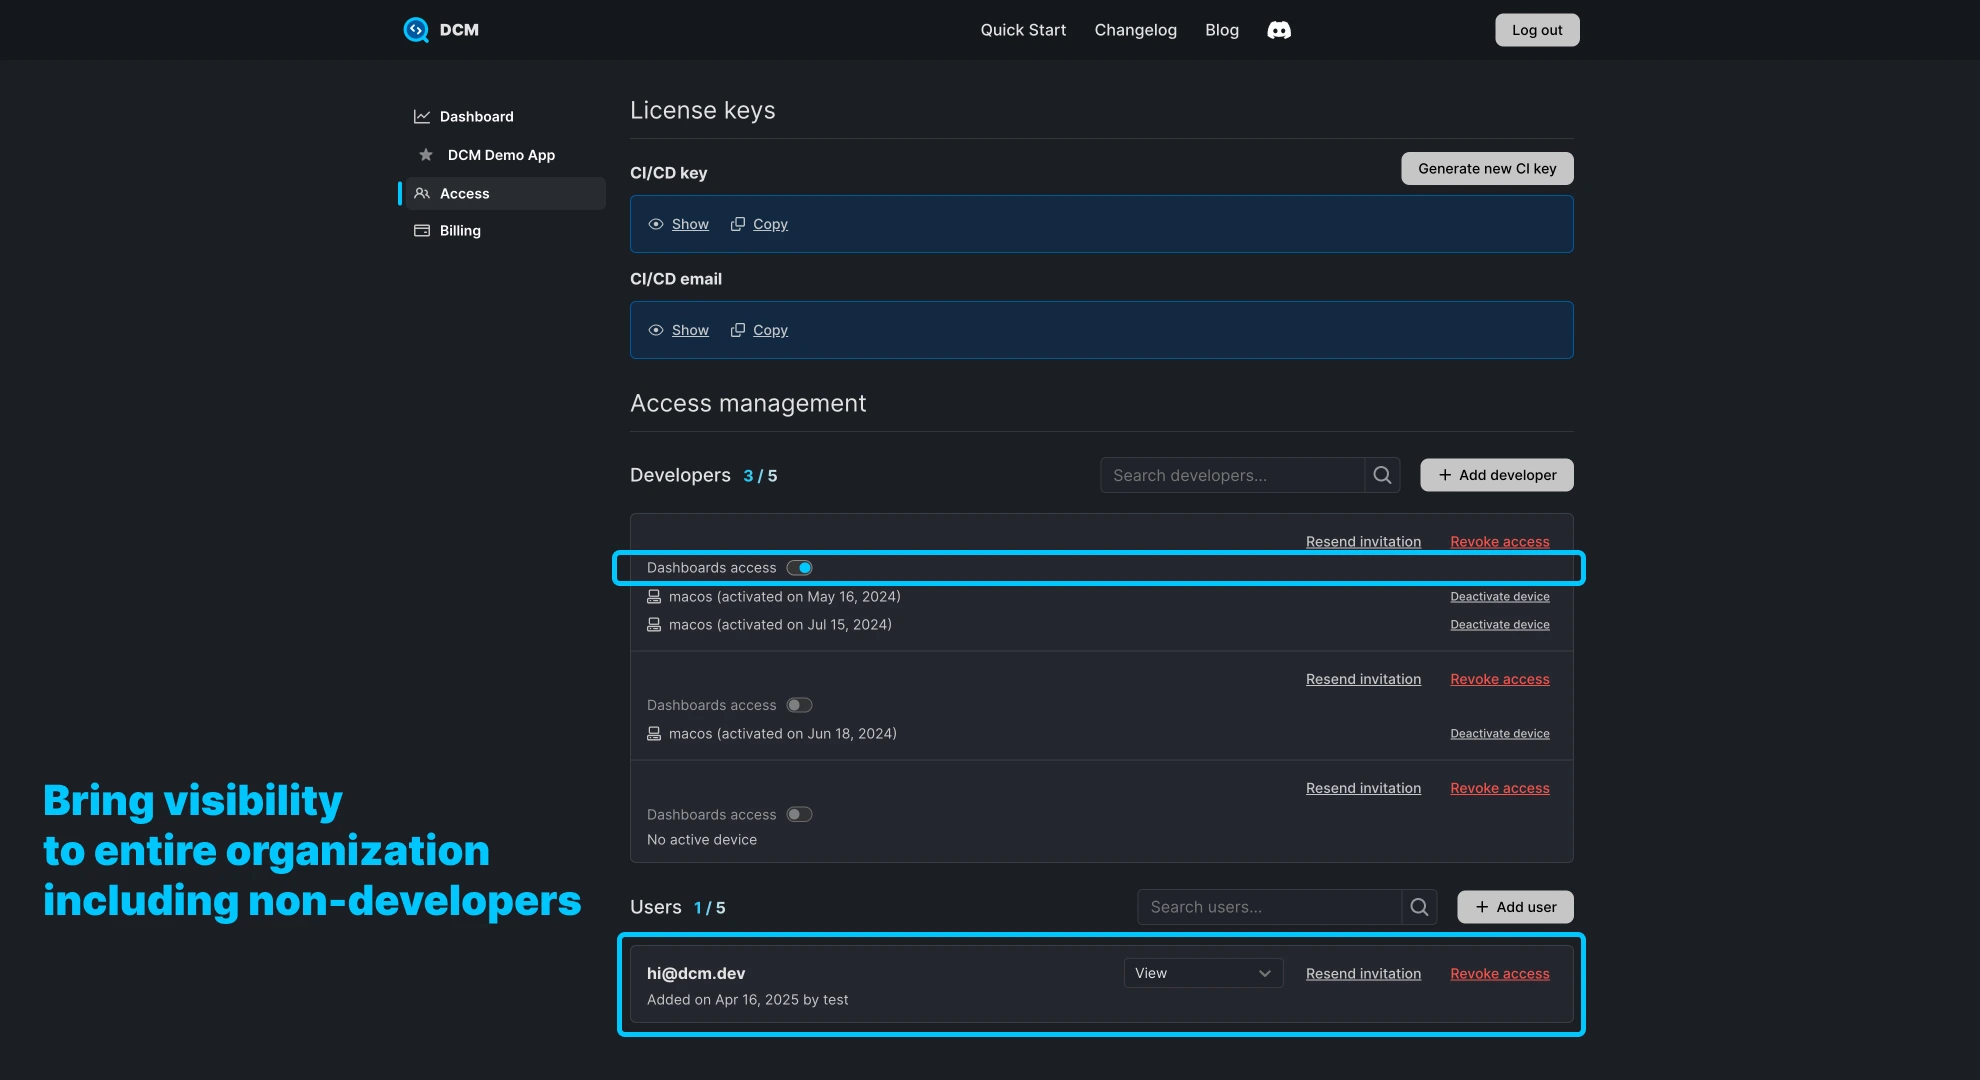
Accessing the Dashboards
Granting access to Dashboards is also available in two ways:
-
Developers: Who have access can also get access to the Dashboards by toggling the access via "Access Management".
-
Users (Non-developers): You can also invite other users who do not directly use the tool to only access the Dashboards or other pages in DCM Teams Console.
Check out our documentation on how to grant access for both of these groups in detail.
How to Update Dashboard?
In DCM 1.27.0 and 1.28.0 we introduced new flags to run command to analyze and upload the metadata to dashboard.
It couldn't be simpler than a one line command:
$ dcm run lib --all --upload --with-details --project=KEY --email=LICENSE_EMAIL
We also have written a complete guide on how to upload end-to-end to update DCM dashboard.
Privacy Reminder
As we stated in closed beta announcement, we never upload your source code or file paths.
Only anonymized metadata is uploaded (e.g., issue type, severity, timestamps, and fix effort), ensuring privacy and security across the board.
What’s Next?
Now that Dashboards is publicly available, we’re shifting our focus toward:
- Advisory (intelligent rule suggestions)
- Advanced filters and segmentation
We’ll announce those features in the coming months. You can always check our public roadmap and helps us prioritize what matters to you most.
Sharing your feedback
Do you have a feature request? or have questions or suggestions, please reach out via email [email protected] or on our Discord server.