Integrating DCM Dashboards
This guide walks you through the complete process of integrating your project with DCM Dashboards from creating a project and choosing an upload strategy, to uploading your analysis results and generating reports.
1. Create Your First Project
A project in the Dashboards is expected to represent a single entrypoint from which the tool is being run. For example, if you run the tool from the root of your repository/package, there needs to be only one project. But if you have multiple packages in your repository and run DCM in each package separately, then you need to create a project for each package.
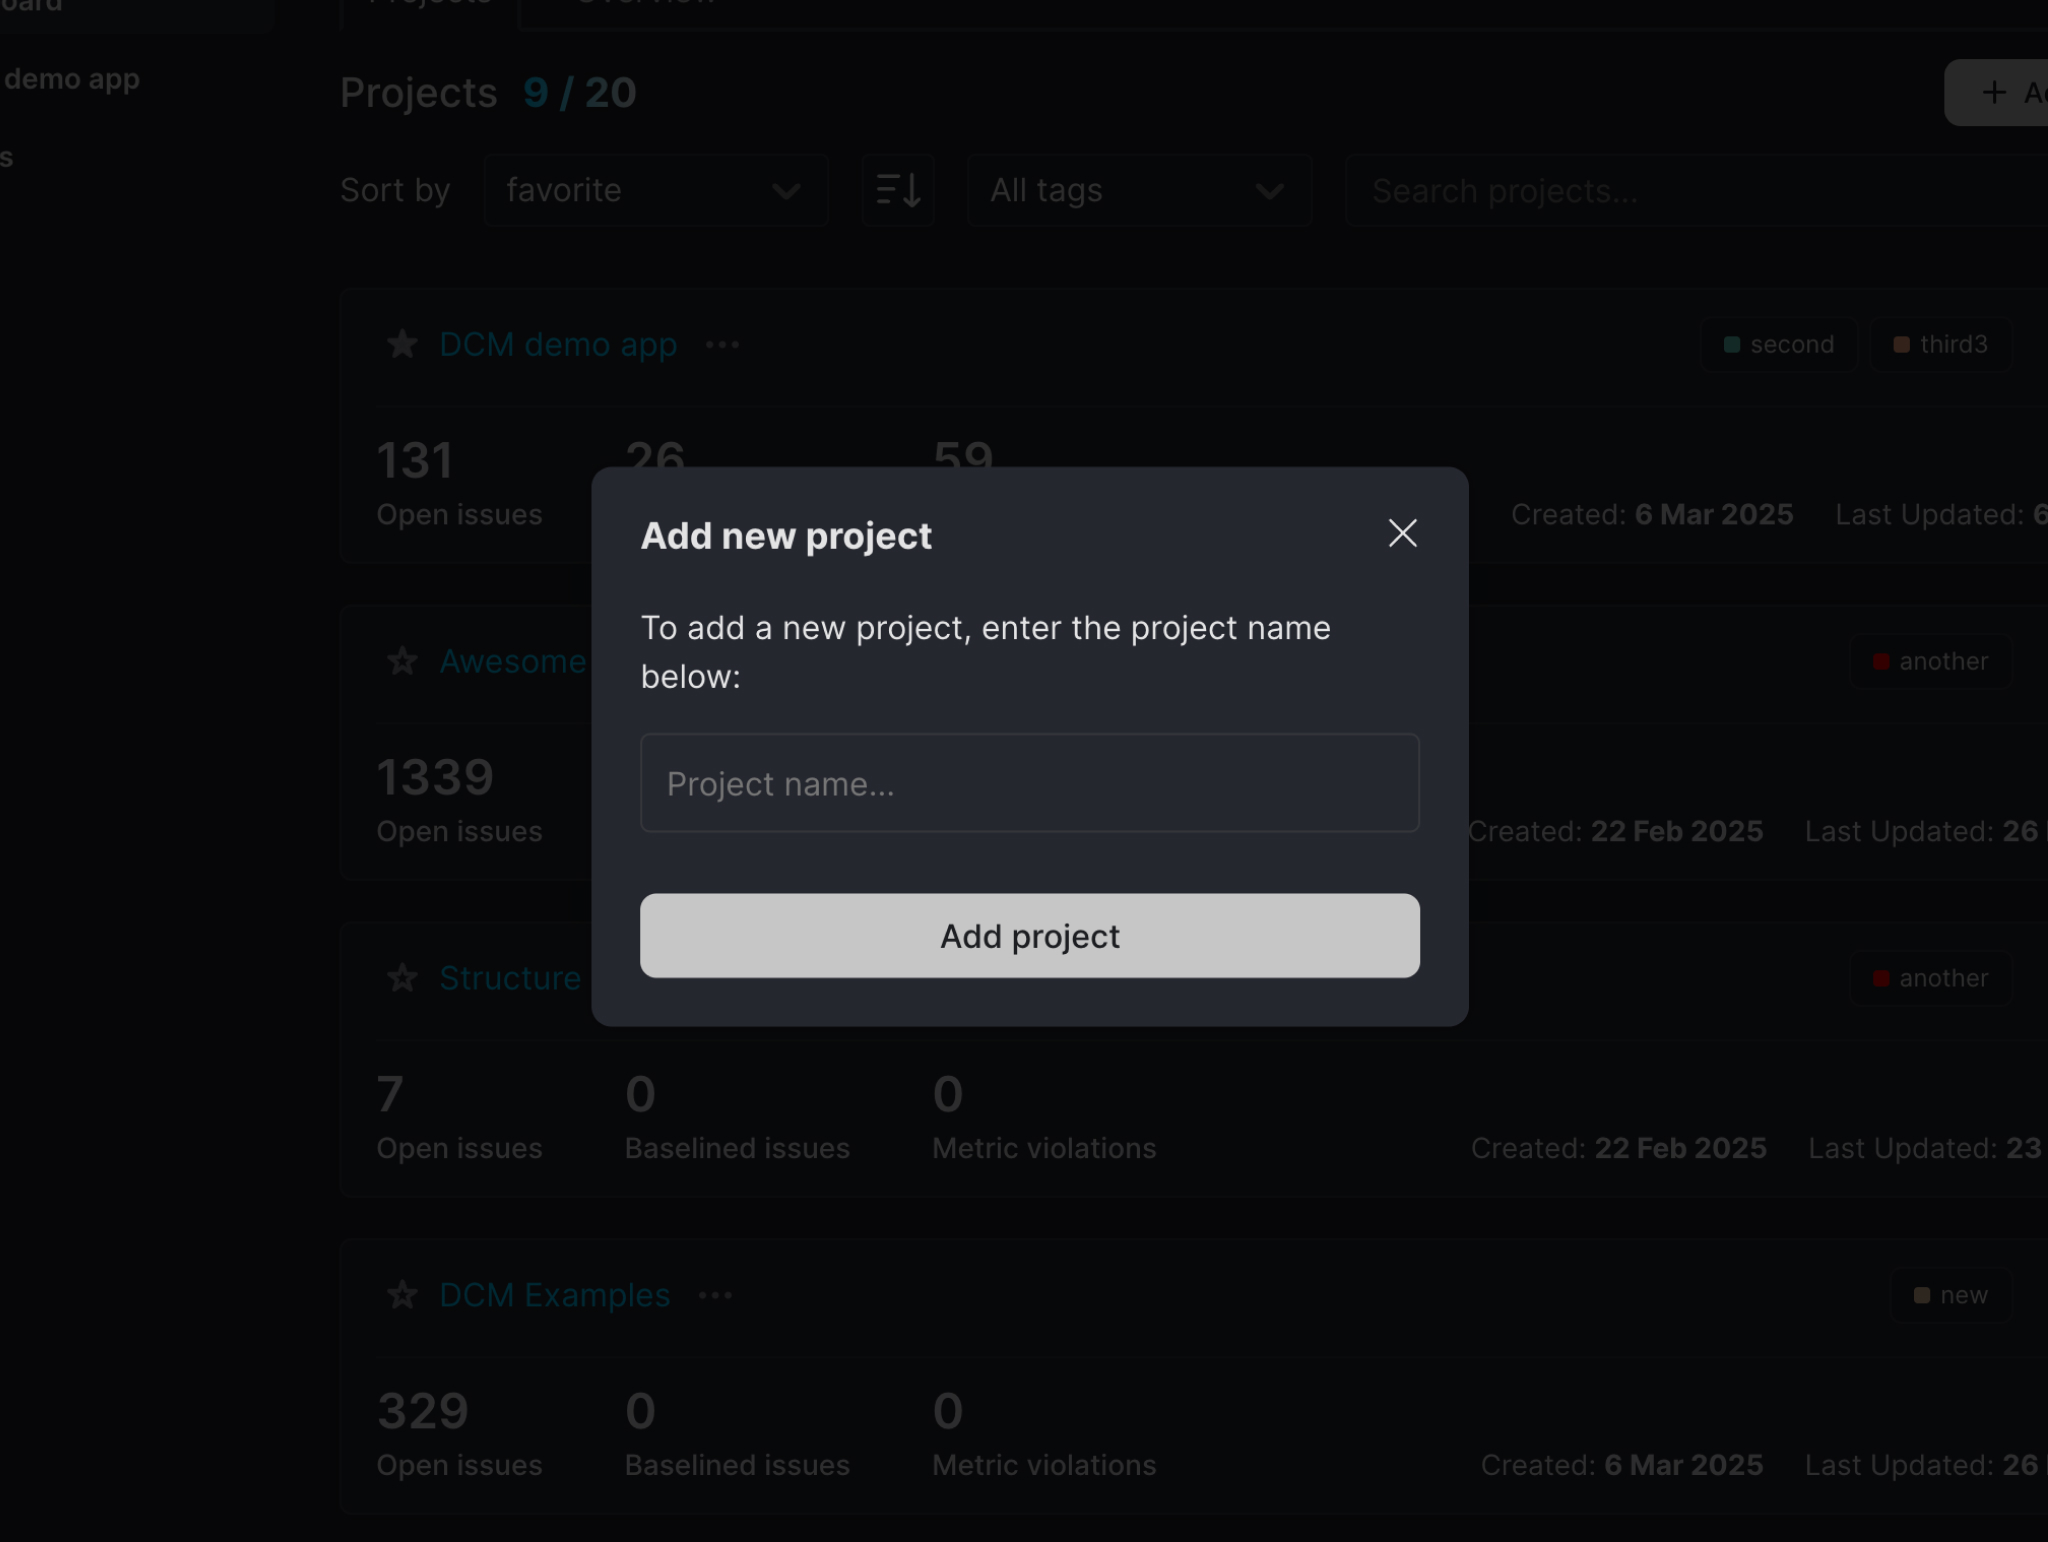
To create a new project:
- Click the
+ Add projectbutton. - Enter a project name.
- Click Add project.
The new project will appear immediately in the list.
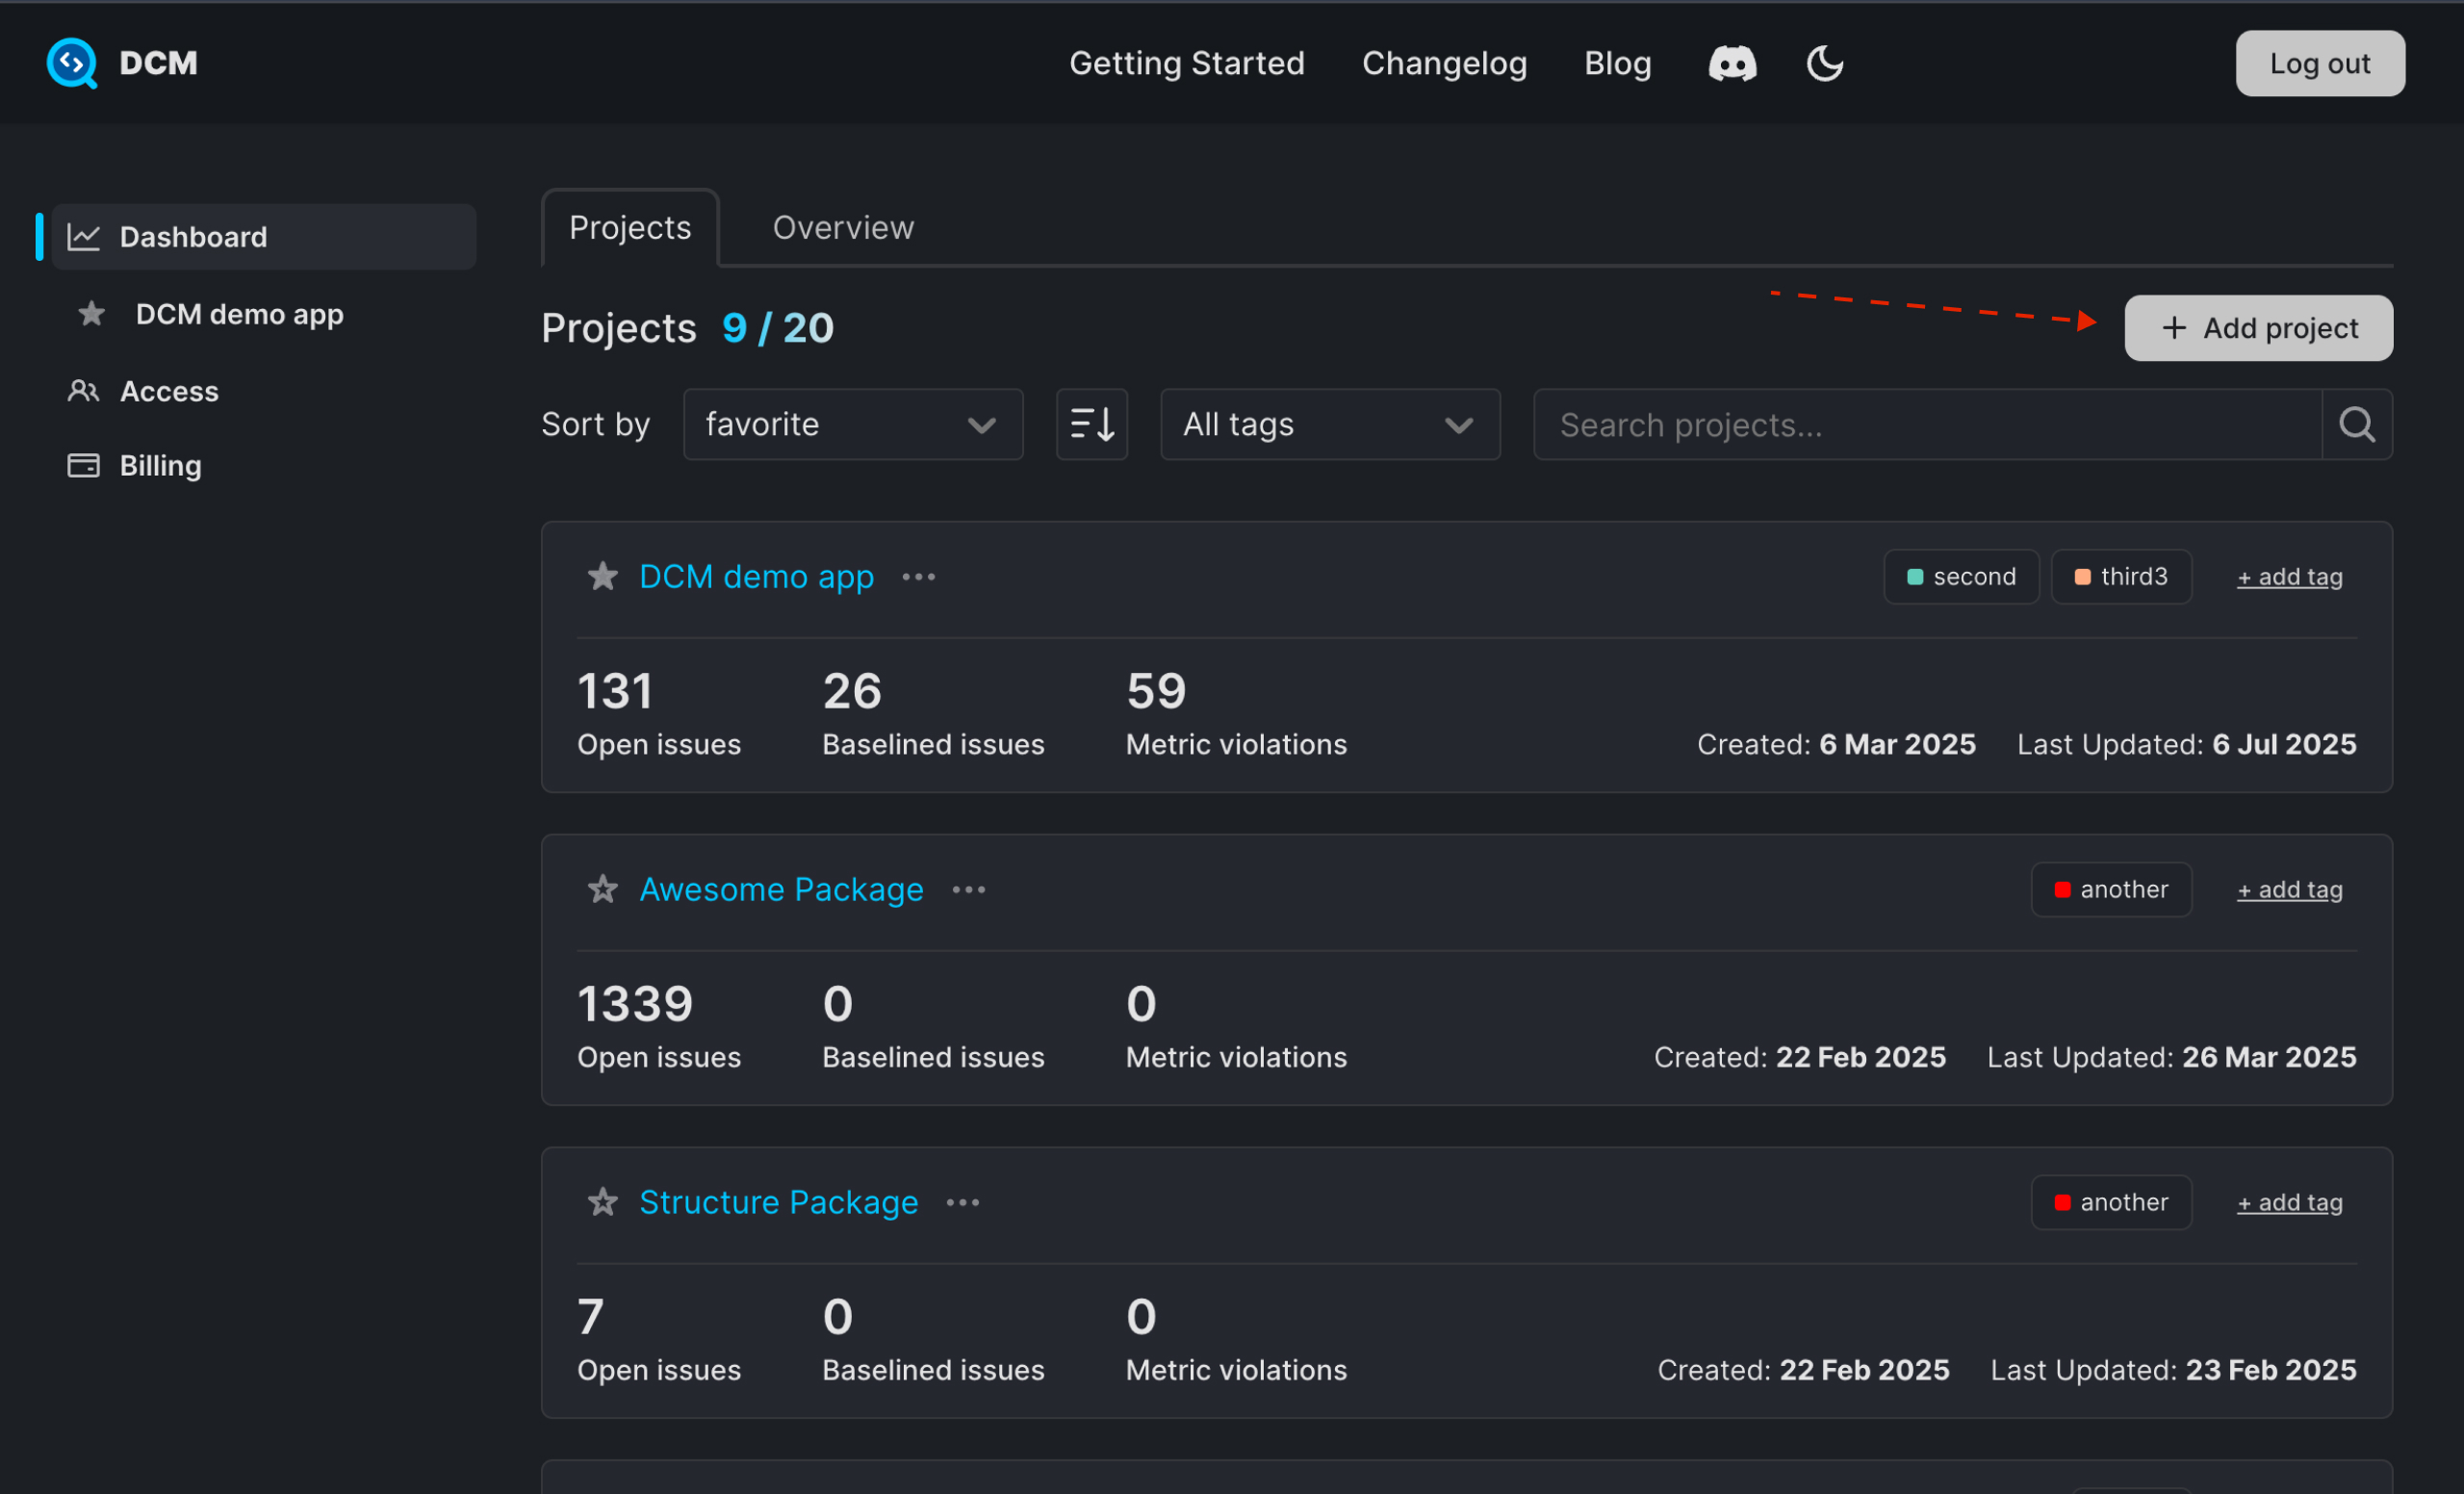
Uploading only from a single branch is supported right now, but if you want to upload from multiple branches (e.g. main and feature-branch), consider creating several project in the Dashboards each representing a branch in your repository.
Automatic Project Creation
This feature is available to Enterprise users only.
To automatically generate Dashboards projects from your monorepo structure:
-
Add a new
projectentry to thedcmconfig in every package'sanalysis_options.yamlfile (this entry can be any string and will be used both as the unique project id and its name, which you can change later):analysis_options.yamldcm:
project: my_monorepo_package
You can also manage project tags by setting project-tags:
dcm:
  project: my_monorepo_package
project-tags:
- some_tag
- another_tag
Those tags will be automatically assigned (or created and assigned) to your Dashboards project. Removing a tag from the list unassigns it from the project, but the tag itself will remain available.
-
Add the
--scaffoldflag to your uploads (and use the Global Project Key for the--projectoption). -
Keep the
--scaffoldflag in every run (not just the first one).
When using --scaffold, the tool will compare unique project ids and create missing projects. Then, it will assign uploaded data to each corresponding project.
If the unique id changes, it will only create a new project and never delete any existing ones.
2. Choose Your Uploading Strategy
DCM gives you the flexibility to upload analysis results either from your local machine or from your CI/CD pipelines, depending on your workflow and deployment strategy.
If you are already running dcm commands on your CI/CD (e.g. dcm analyze lib or dcm check-unused-code lib), uploading your project data is not a replacement for those checks and should be set up independently.
Branch
First, you need to decide which branch should be used to deploy data to the created project. We do recommend you to create a project for a branch or staging / testing environment and separate it from your production environment or main branch.
Local
You can run DCM analysis and upload results directly from your local machine. DCM supports running checks and uploading in a single command, so you don’t need to split the workflow:
dcm run lib --all --upload --project=PROJECT_KEY --email=LICENSE_EMAIL
CI/CD (Recommended)
While local uploads are good for testing/initial uploads, it's recommended to ingrate DCM into your CI/CD pipeline. Typically, it can be triggered on merges to your main branch. This keeps your Dashboards up-to-date with every meaningful change.
Here is an example of Github Action:
jobs:
  analyze:
    runs-on: ubuntu-latest
    steps:
      - uses: actions/checkout@v3
      ...
      - name: Run DCM and Upload
        run: |
          dcm run lib \
            --all \
            --upload \
            --project=${{ secrets.DCM_PROJECT_KEY }} \
            --email=${{ secrets.DCM_LICENSE_EMAIL }} \
            --ci-key=${{ secrets.DCM_CI_KEY }}
Dashboards support uploads at any time, daily, weekly, or even multiple times a day.
Just keep in mind, only the latest upload per day is kept. If you upload more than once in a day, the newest upload will overwrite the previous one to ensure the dashboard always reflects the most recent data.
3. Upload Your Metadata
Here’s a typical command that runs a full analysis and uploads everything:
dcm run lib --all --upload --project=PROJECT_KEY --email=LICENSE_EMAIL
Each flag is responsible to handle a task:
--all- Runs all available code quality checks.--upload- to indicate that the results of the command should be uploaded--project- to pass the unique key of a project in your DCM Dashboards
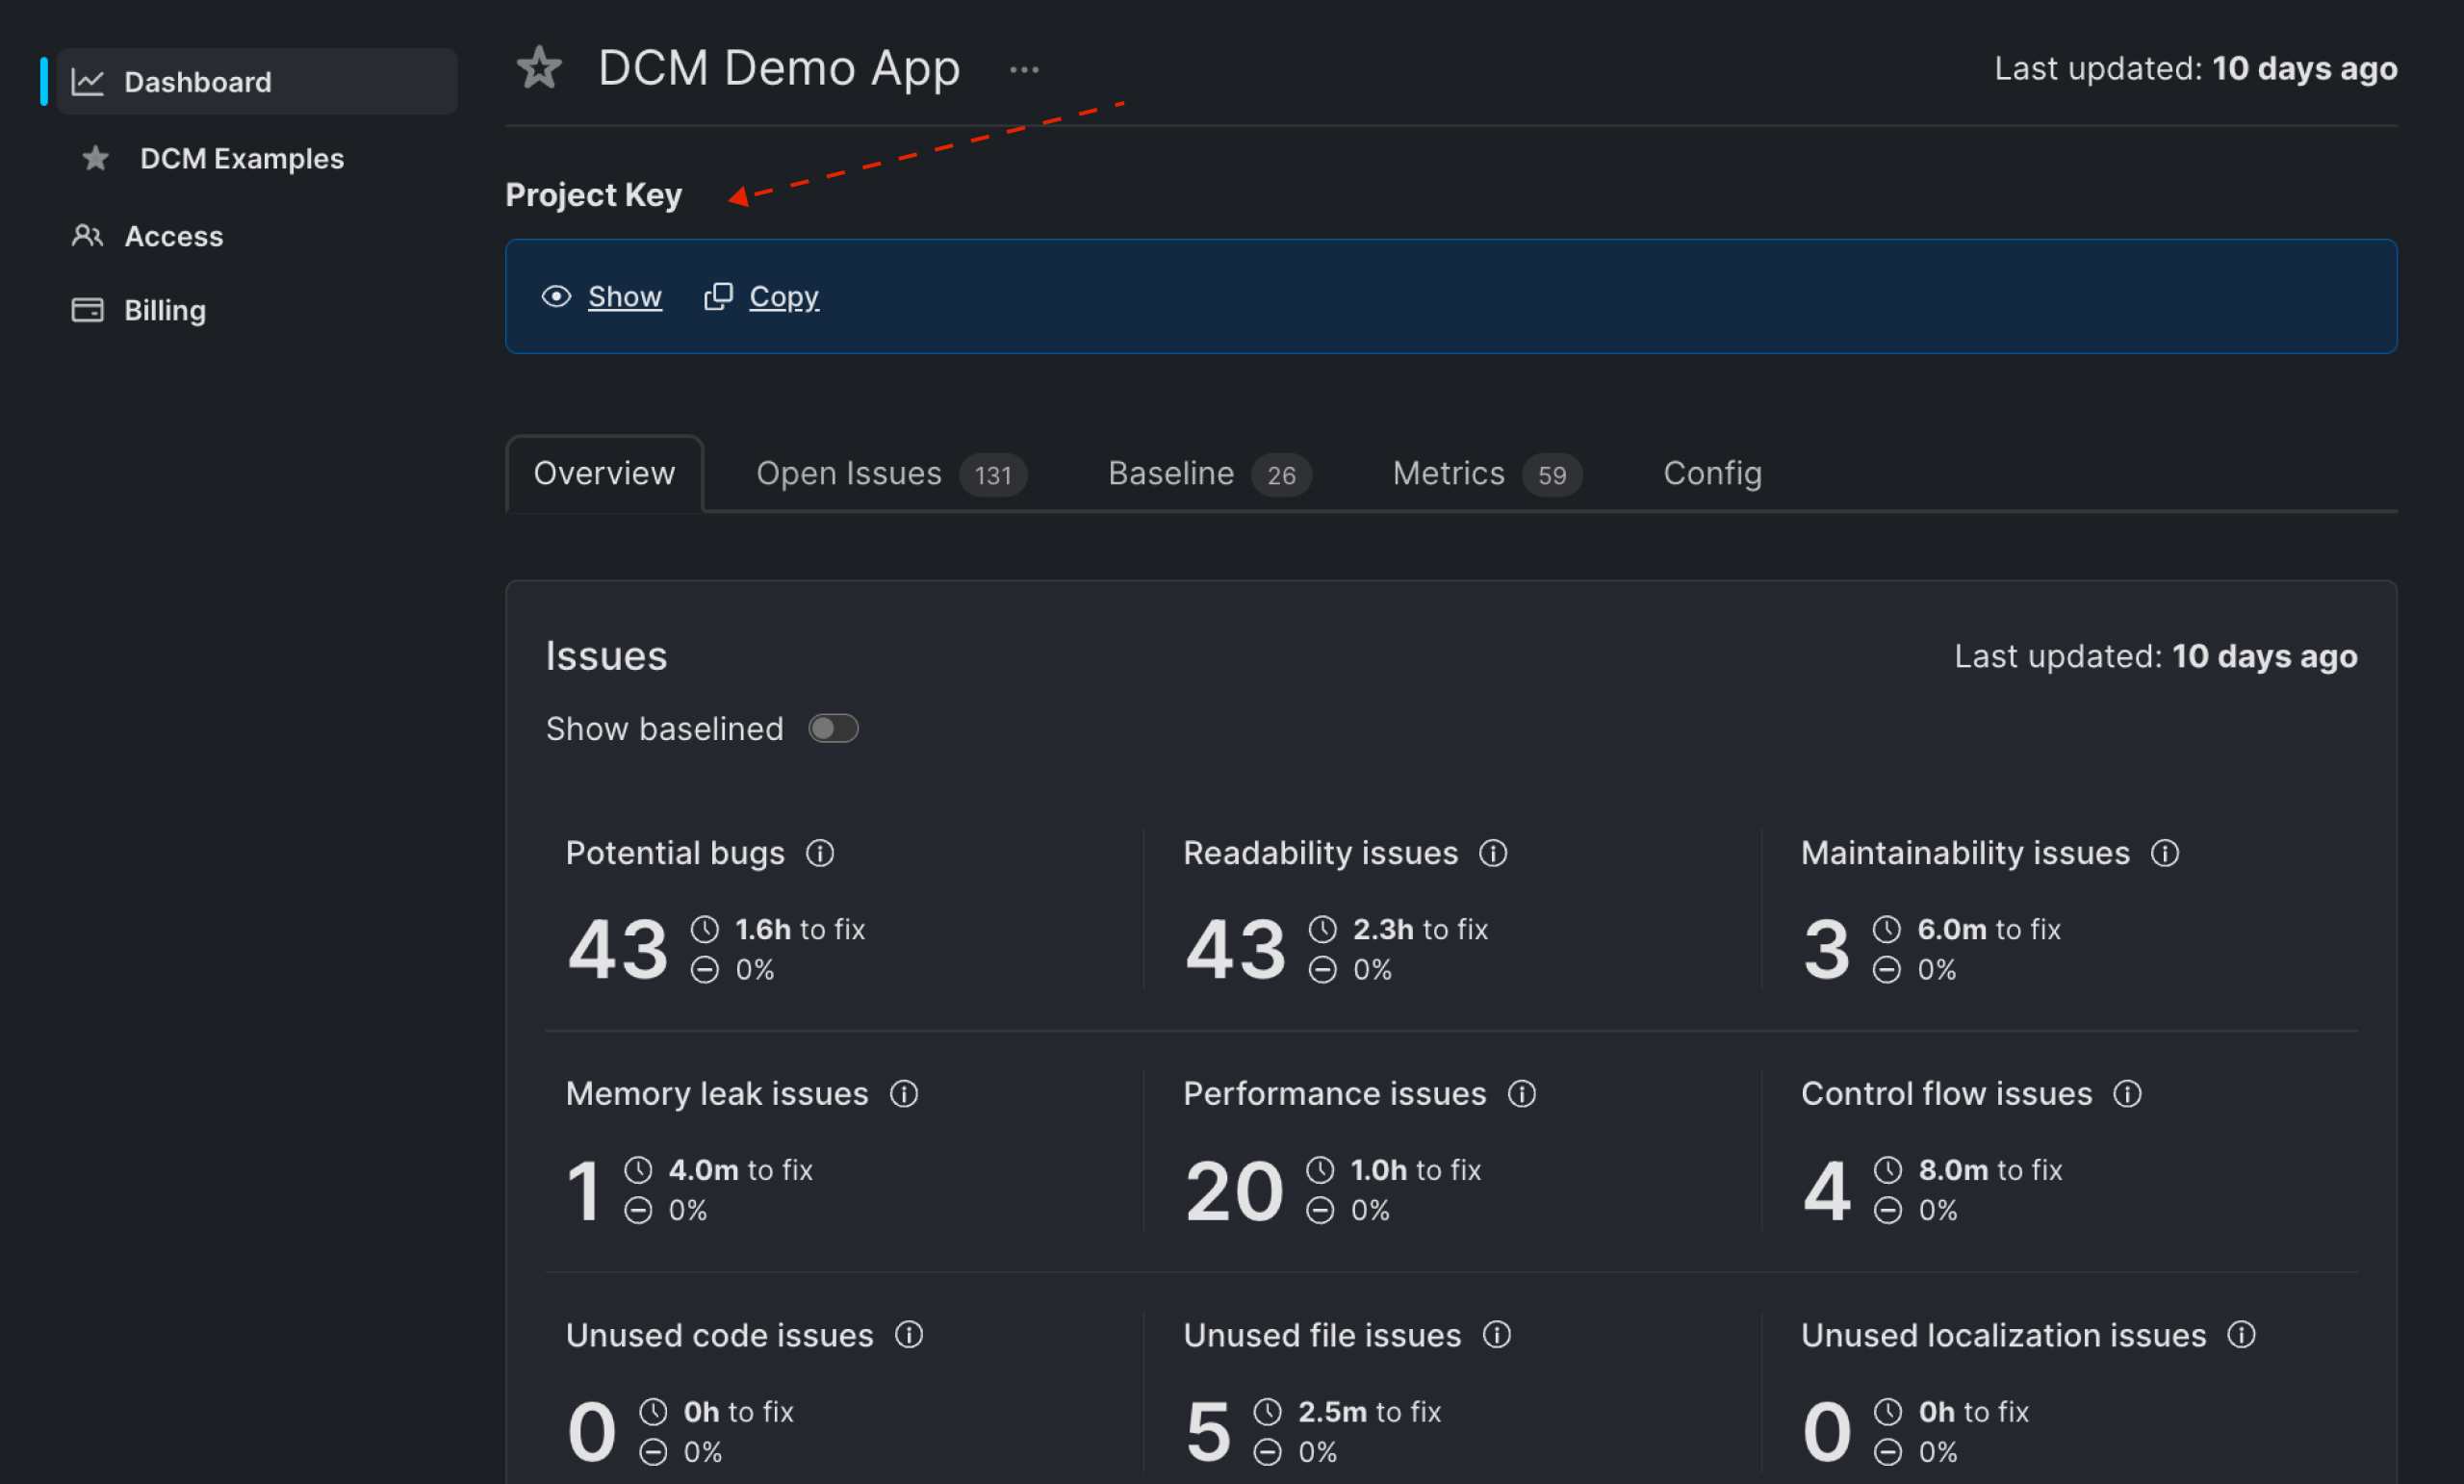
Accessing the Project Key
You’ll find the Project Key at the top of the selected project page in your DCM Dashboards. Copy and use it in all your --project flags to ensure the data is correctly linked.
Selecting Code Quality Checks
Instead of --all, you can target specific types of analysis based on your goals:
dcm run lib \
  --analyze \
  --metrics \
  --code-duplication \
  --upload \
  --project=PROJECT_KEY \
  --email=LICENSE_EMAIL
If you are passing --analyze or --metrics, don't forget to enable DCM lint rules or metrics in your package's analysis_options.yaml.
Available check flags include:
    --all                                          Run all dcm commands.
    --analyze                                      Run dcm analyze.
    --metrics                                      Run dcm calculate-metrics.
    --analyze-assets                               Run dcm analyze-assets.
    --code-duplication                             Run dcm check-code-duplication.
    --unused-code                                  Run dcm check-unused-code.
    --unused-files                                 Run dcm check-unused-files.
    --dependencies                                 Run dcm check-dependencies.
    --unused-l10n                                  Run dcm check-unused-l10n.
Note that the other flags are not available for Dashboards including:
    --parameters                                   Run dcm check-parameters.
    --analyze-widgets                              Run dcm analyze-widgets.
    --exports-completeness                         Run dcm check-exports-completeness.
    --unnecessarily-public-code                    Run dcm check-unnecessarily-public-code.
Keep in mind that every time you upload data with specific flag, it will override the entire previous dashboard data to ensure the data is always up-to-date.
Passing a Specific Upload Date
By default, the upload date is the same as the command run date. To override this behavior, pass the --upload-date="YYYY-MM-DD" option.
For example,
dcm run lib --all --upload --upload-date="2025-04-15" --project=PROJECT_KEY --email=LICENSE_EMAIL
will assign the upload date to April 15th, 2025.
Same as for the regular uploads, if you upload multiple times for the same date, only the last uploaded result will be shown in the Dashboards.
Overriding DCM Configuration
By default, dcm run --upload uses analysis_options.yaml files to detect available DCM configuration (same as other commands).
To override this behavior for uploads, pass the --upload-options-path= option with the path to a custom configuration file (for example, dcm_shared_options.yaml (adding the dcm_ prefix also enables autocompletion and validation for that file)). Note that this configuration will apply to all analyzed packages.
Using this option allows to have 2 separate configurations: one for local and CI runs and another only for uploads.
Previewing the Results Before Uploading
To preview the collected metadata, add the --preview-upload flag.
With this flag the tool performs a dry run and shows what would be uploaded without sending any data.
dcm run lib --all --upload --preview-upload --project=PROJECT_KEY --email=LICENSE_EMAIL
and here is the result in your console:
{
  "project": "<hidden>",
  "email": "<hidden>",
  "date": "2025-04-25T13:13:15.516343",
  "dateOverride": null,
  "version": "1.30.0",
  "summary": {
    "issues": {
      "prefer-dedicated-media-query-methods": 20,
      "avoid-non-null-assertion": 30,
      "prefer-single-widget-per-file": 27,
      "prefer-spacing": 7,
      "dispose-fields": 1,
      "no-empty-block": 6
    },
    "baselinedIssues": {
      "avoid-unused-parameters": 1,
      "avoid-commented-out-code": 3,
      "proper-super-calls": 1,
      "prefer-match-file-name": 8,
      "avoid-unused-instances": 1,
      "prefer-correct-callback-field-name": 1,
      "avoid-missing-controller": 1,
      "avoid-redundant-else": 4,
      "avoid-unsafe-collection-methods": 2,
      "avoid-shadowing": 1,
      "unused-code-issue": 26
    },
  },
  "passedCommands": [
    "analyze",
    "unused-code"
  ],
}
4. View the Results
After you uploaded the data successfully, your data is available immediately on the dashboard.
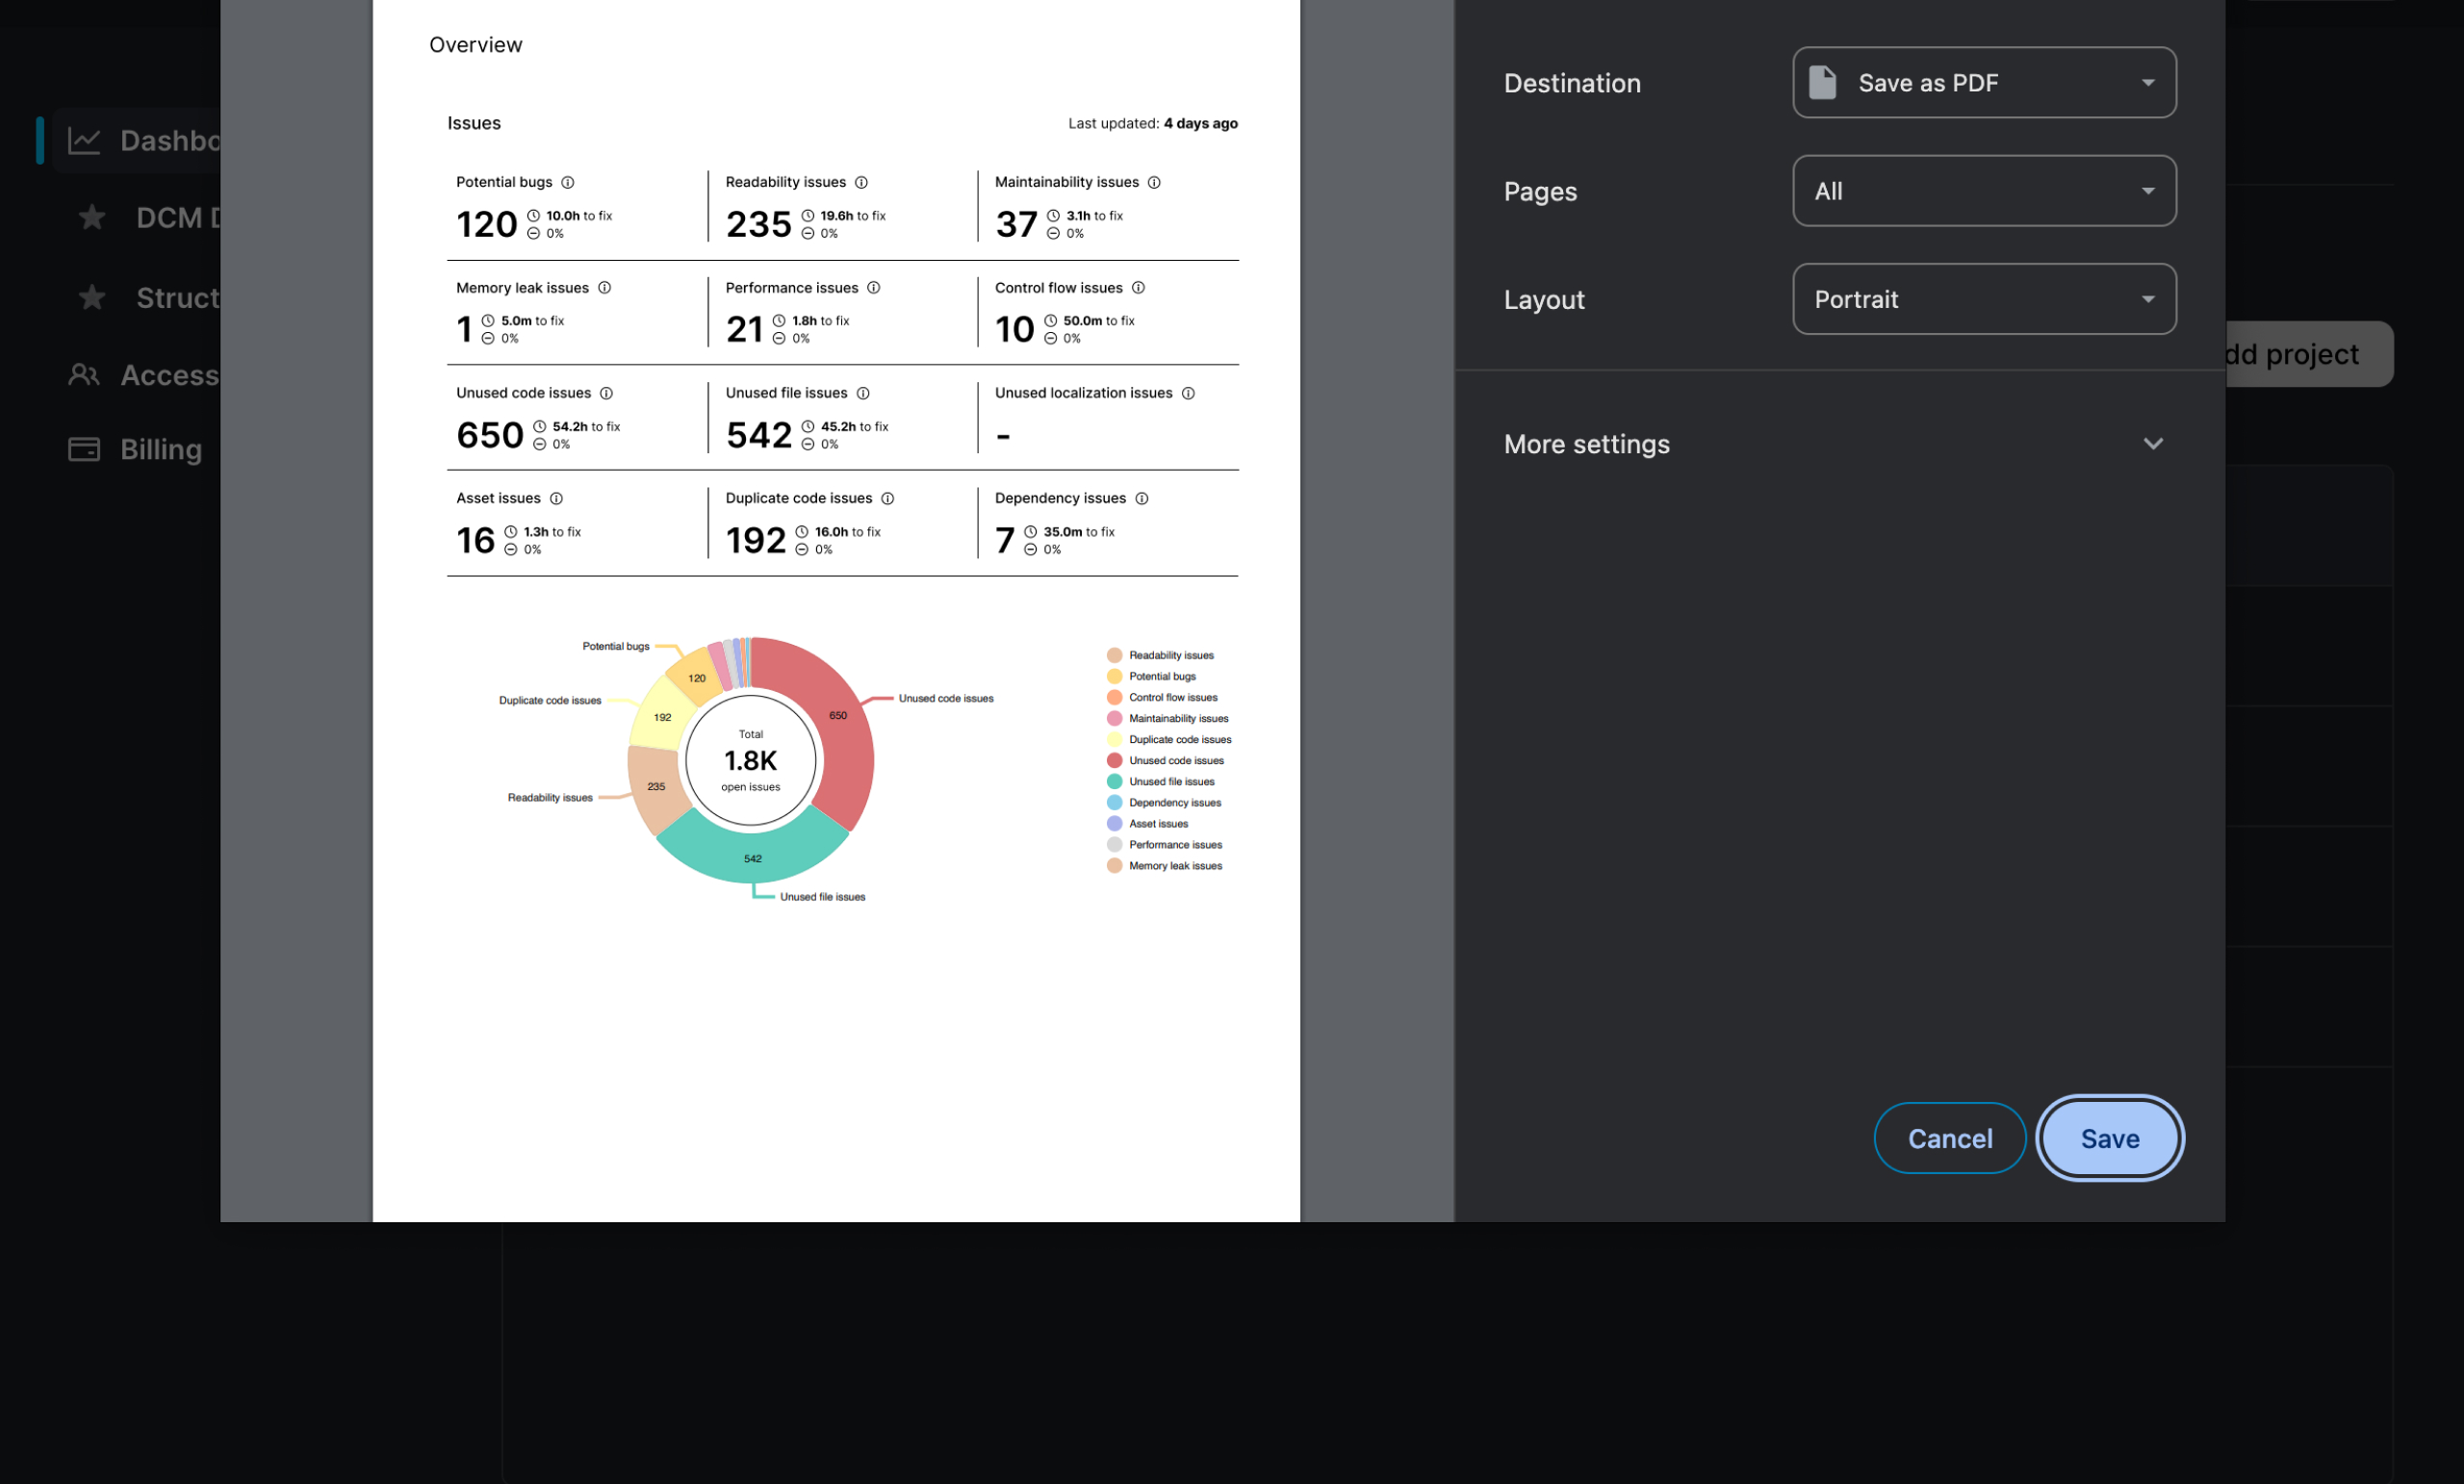
5. (Optional) Generate a Report
If you need to print or generate a report for stakeholders and share it with your customers,managers or teammates, use the browser ctrl+P/cmd+P menu and save the page as PDF.