Android Studio / IntelliJ Plugin
To get real-time display of analysis errors in your IDE, install the DCM plugin.
To download the plugin, click the button below or search DCM in the IntelliJ / AS plugins list.
Plugin Capabilities
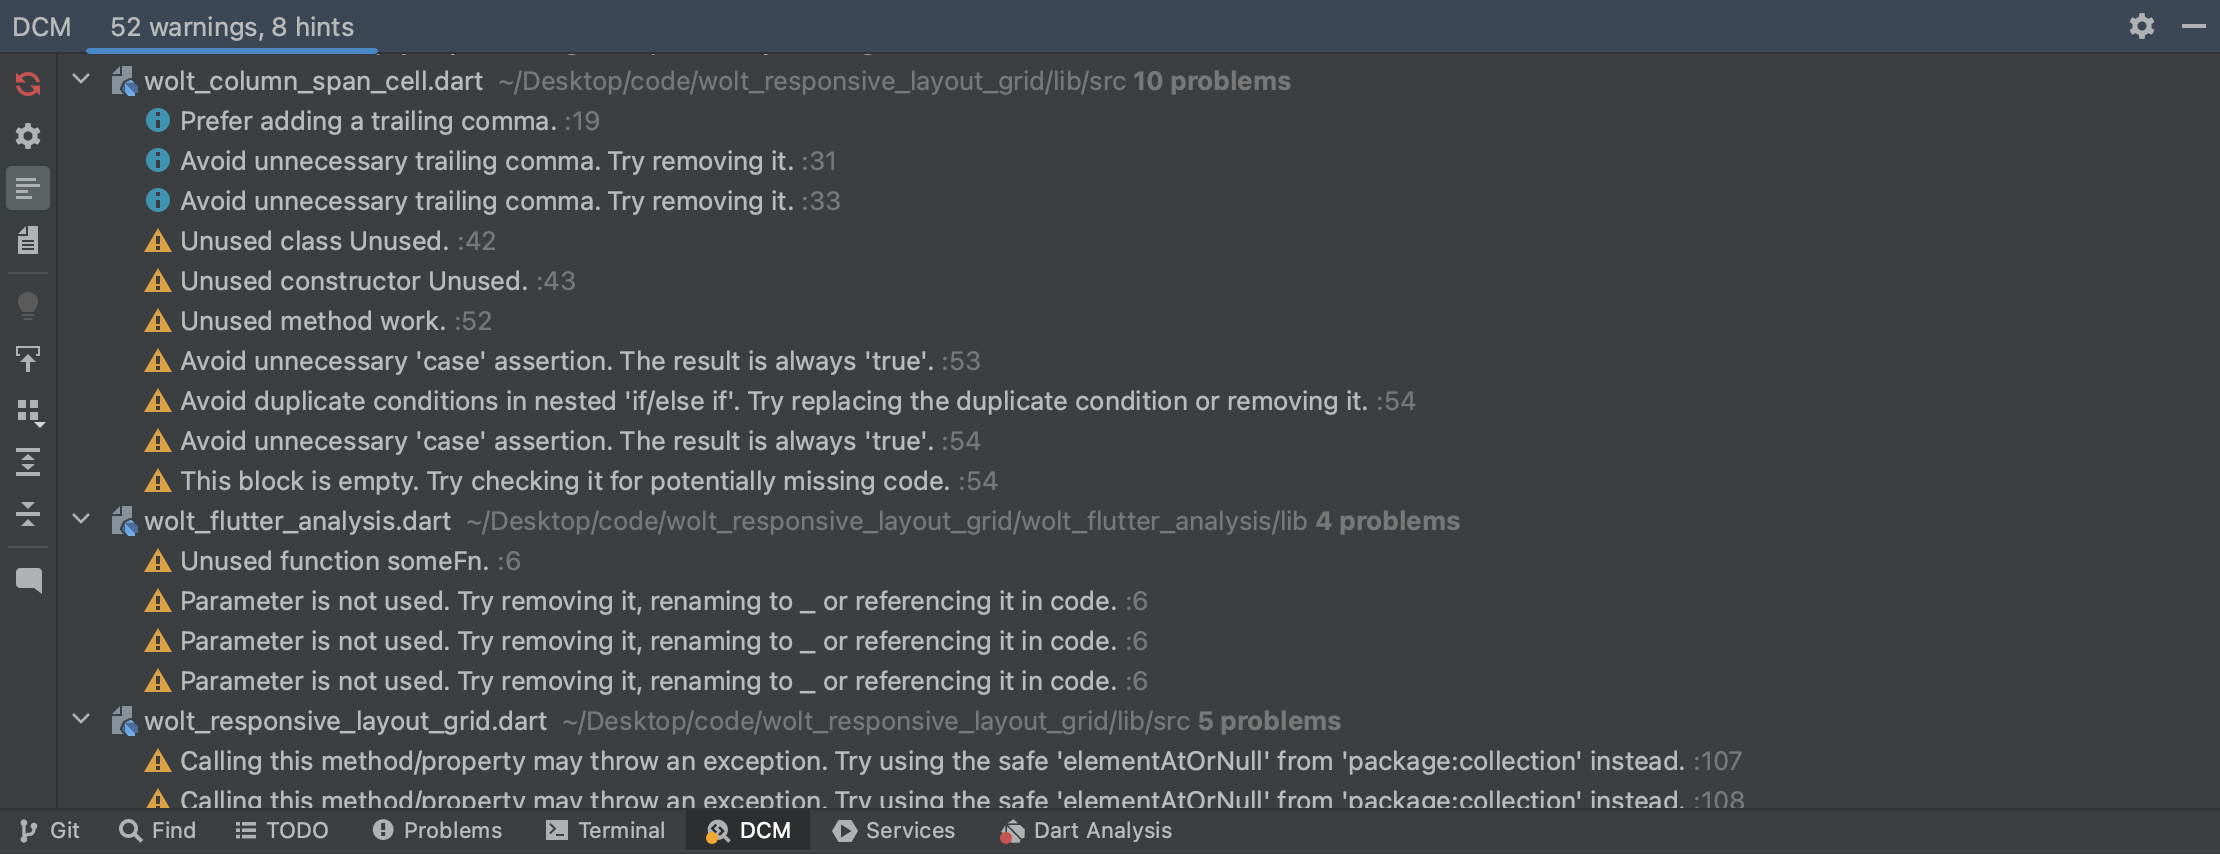
All the errors calculated by the analysis process will be displayed in the opened files and the DCM Problems View.
Quick fixes are also available, simply call the quick fix menu on the issue in the opened file.
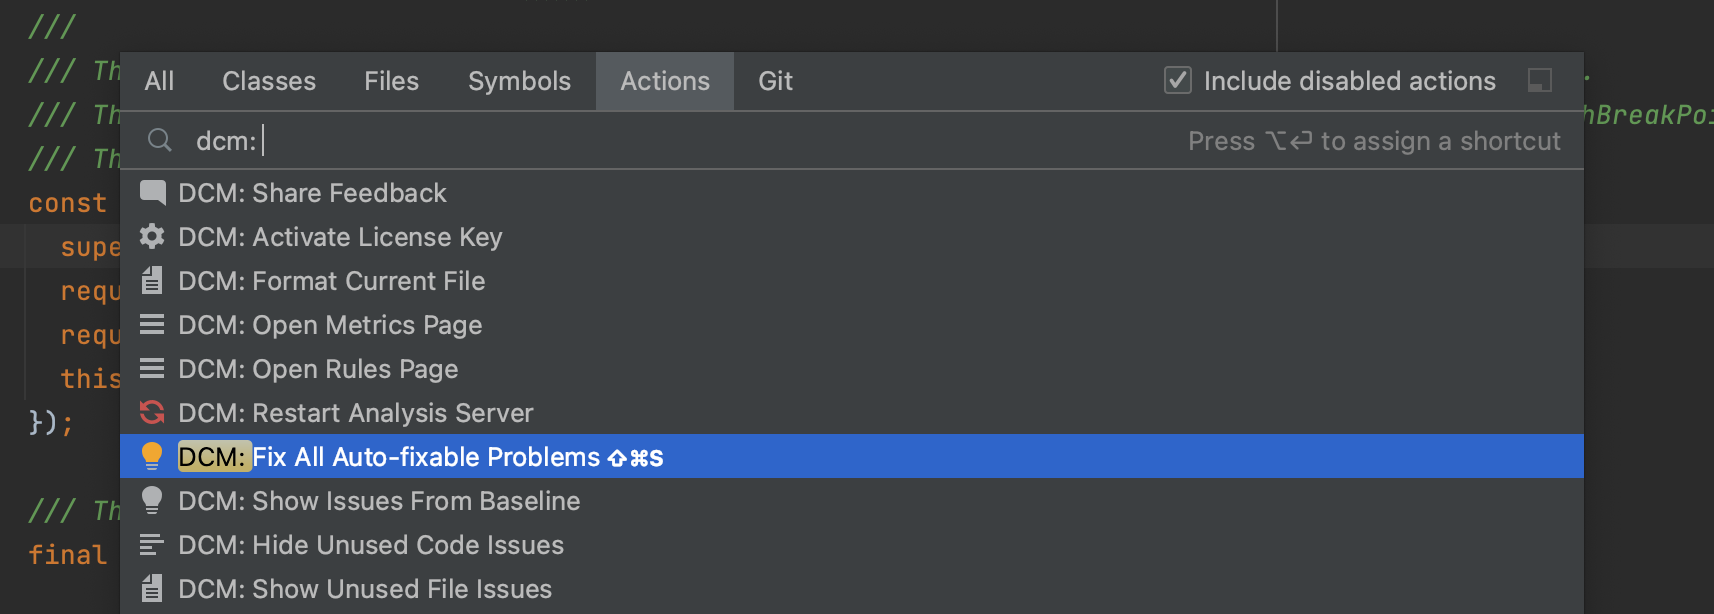
You can quickly fix all fixable DCM rule issues with the "DCM: Fix All Auto-fixable Problems" IDE command or via a shortcut ⌘ + Shift + S.
MCP Server
To enable the DCM MCP Server in IntelliJ, refer to this guide. For Android Studio, refer to this one.
Assists
Wrap with a Custom Widget
Analysis Options Files
If the analysis_options.yaml file is open, the plugin will mark all rules that support additional config with ⚙️ icon.
![]()
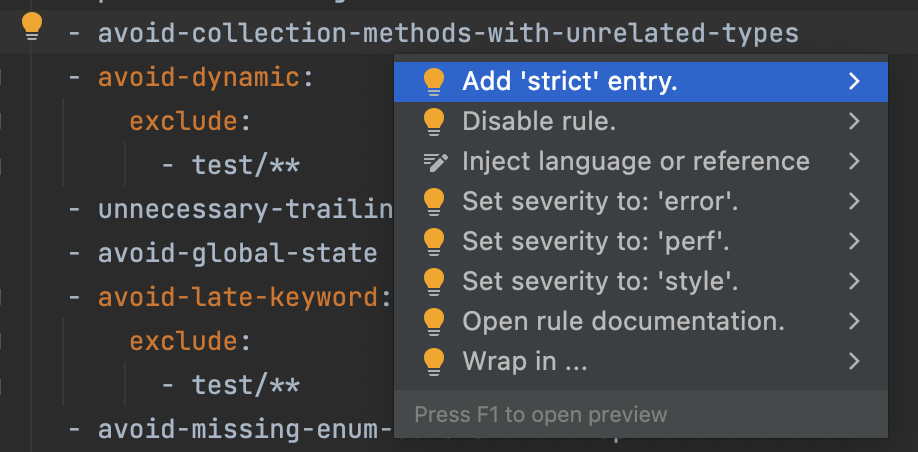
You can also call the code actions menu on each rule to quickly change its severity, disable it or open the rule documentation.
Custom Analysis Options Files
Aside from the regular analysis_option.yaml file, you can add a custom config file that matches one of the given patterns
- starts with
analysis_options(e.g.analysis_options.1.1.0.yaml) - starts with
dcm(e.g.dcm_config.yamlordcm.yaml) - placed inside a folder called
dcm(e.g.dcm/config.yaml)
If such a file is referenced by any analysis_option.yaml file, DCM will correctly update configuration changes, validate rule names and display a configuration icon (⚙️) for configurable rules.
However, unlike regular analysis_options.yaml files, code actions are not available.
DCM Problems View
A separate view is used to display the errors, calculated by the analysis process. Several other actions are also available from this view (e.g. restarting the analysis process or calling the quick fix menu for the selected problem).
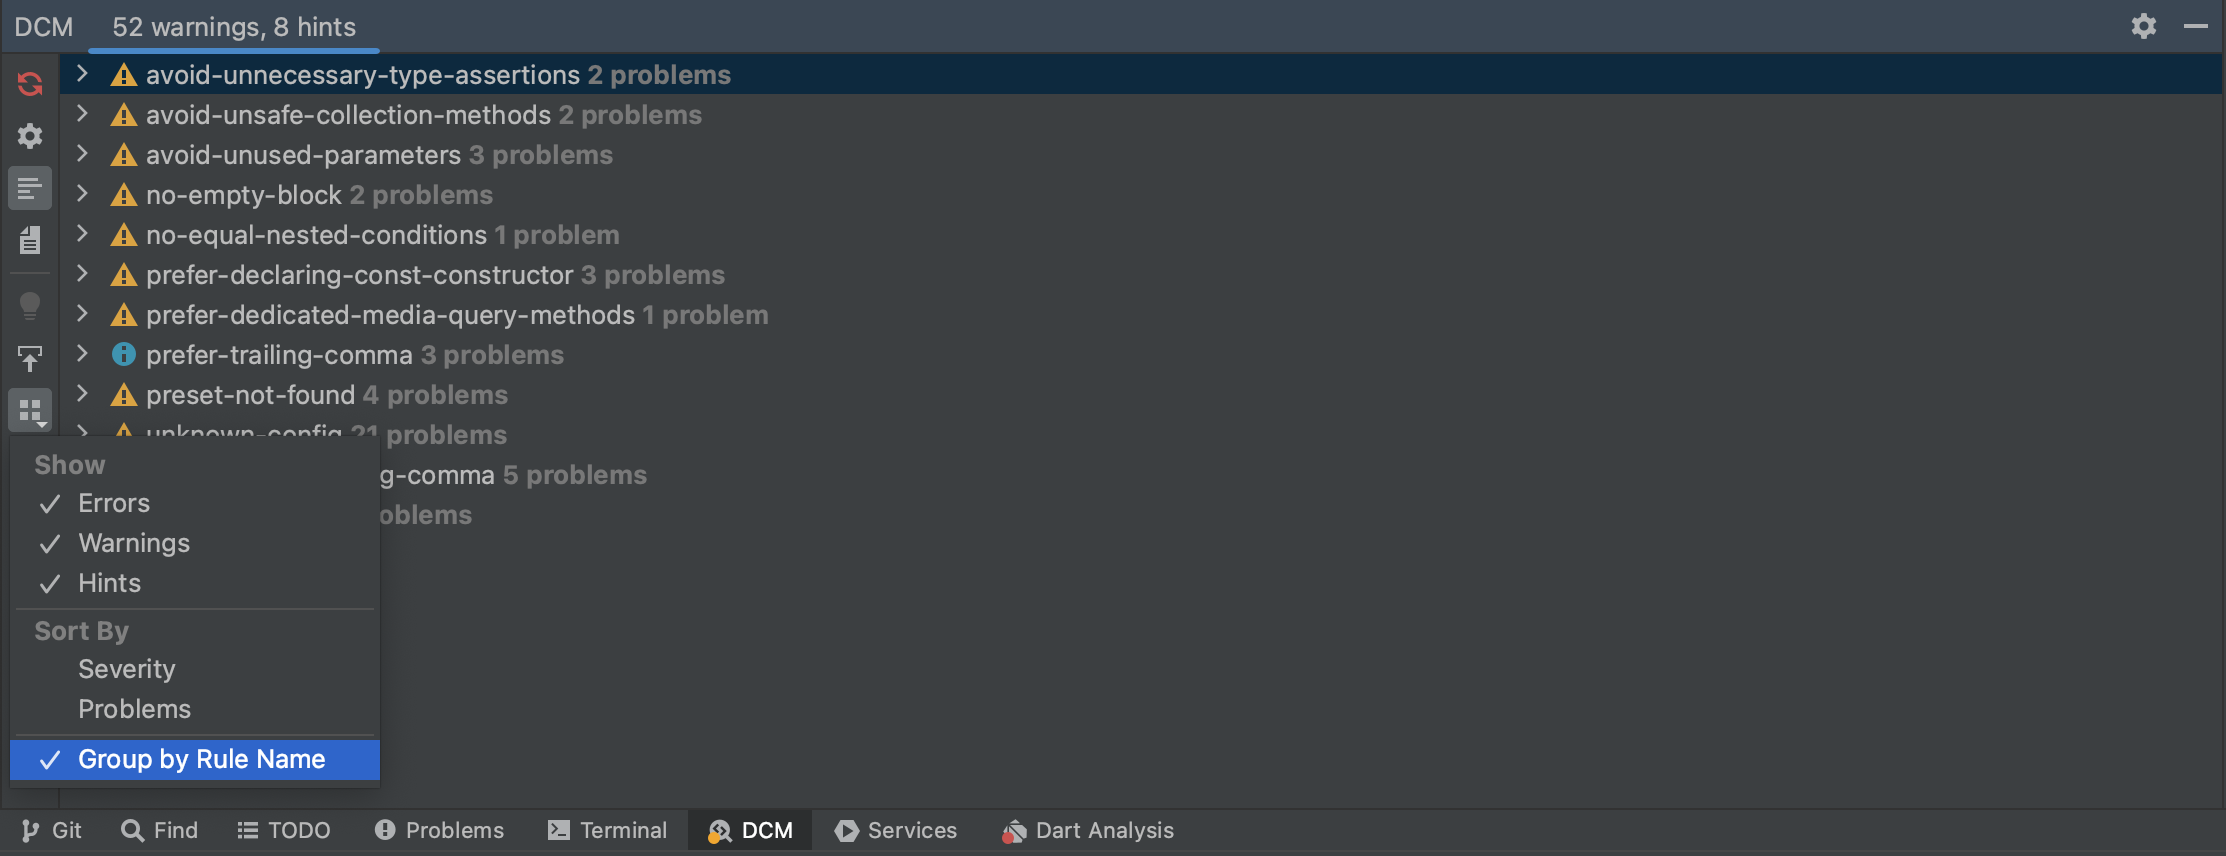
To filter errors by severity, use the filter menu.
DCM Status Widget
You can easily see the status of the DCM analysis process in the bottom right corner of the IDE. Clicking on the status widget allows you to call additional actions (e.g. restarting the process or seeing the timeouts for analysis requests).
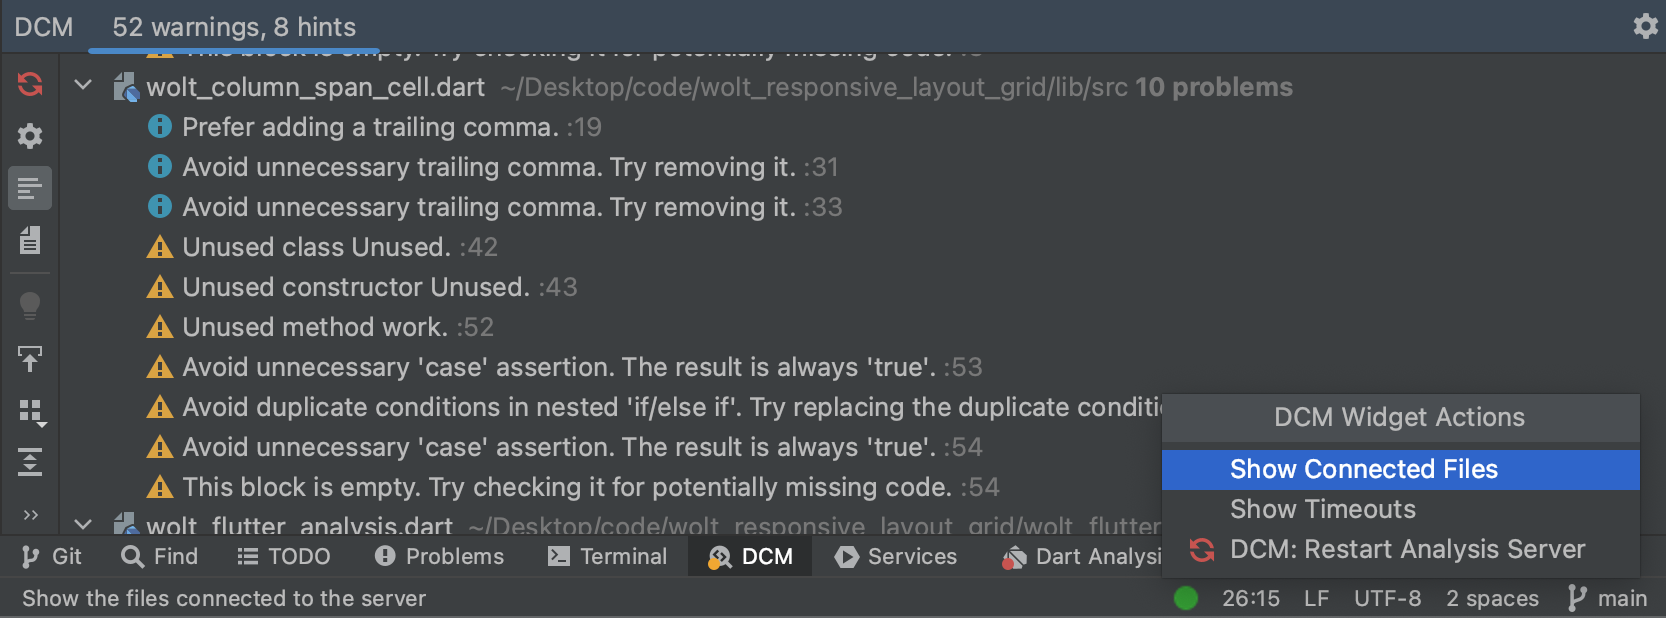
Available Commands
- DCM: Restart Analysis Server
- DCM: Activate License Key
- DCM: Share Feedback
- DCM: Fix All Auto-fixable Problems
- DCM: Format Current File
- DCM: Show Issues From Baseline
- DCM: Hide Issues From Baseline
- DCM: Open Rules Page
- DCM: Open Metrics Page
Available Configuration
- Dart SDK Path - is detected automatically if listed in PATH, but can be set up explicitly, if another version of the SDK should be used. FVM is also supported, if the project has a
.fvm/flutter_sdksymlink - it will be used by the plugin as well. - DCM Executable Path - is detected automatically if listed in PATH, but can be set up explicitly.
- Show New Version - Show a notification when there is a new DCM version available.
- Disable Baseline - Disable baseline and show ignored issues in the IDE.
- Analyze Only Opened - Only analyze projects with open files.
- Highlight Only Files With Errors - Highlight only files with errors in Project View.
- Enable Old Formatter - Enable pre-Dart 3.7 formatter.
Locating the Dart SDK
By default, the tool searches for the Dart SDK location in your PATH.
If it fails to locate the SDK there, here is the list of all places used to locate the SDK (in that particular order):
--sdk-pathCLI option (if present)- the
DCM_SDK_PATHenv variable (if present) - the
FLUTTER_ROOTenv variable (if present) fvmconfiguration (see Using DCM with FVM for detailed integration).dart_tool/package_config.jsonwhich flutter/where flutter(depending on the platform)
These steps cover most popular ways of installing Flutter (manually, via fvm, asdf or other similar tools).
Manually Locating the SDK
If for some reason the Dart SDK was not located automatically, pass the --sdk-path CLI option with the absolute path to the SDK folder when calling any DCM command (or provide it via the DCM_SDK_PATH env variable).
For a locally installed Flutter SDK, the expected folder is named dart-sdk and is typically located at ...flutter/bin/cache/dart-sdk (where flutter is the Flutter SDK folder). Alternatively, you can run which dart (or an alternative Windows command) and replace /dart with /cache/dart-sdk.
If you are setting the path to the Dart SDK manually, consider reaching out to our support team.
We are interested in supporting as many cases as possible to ultimately reduce the need for manual setup to zero.
Locating Plugin Logs
To find the plugin logs, use this official IntelliJ documentation guide.
All DCM log entries begin with the "com.dcm" prefix.
Ensuring the Entire Team Installs the IDE Plugin
To ensure that your entire team installs the IntelliJ / AS plugin, configure the list of "Required plugins".
Enabling Inline Diagnostics
To have diagnostics appear as text at the end of the line, consider installing an additional IDE plugin (for example, Inspection Lens).
Make sure the installed third-party plugin is not malicious. We are not liable for any damage caused by third-party plugins.
Changelog
See the changelog.