Choosing Your First DCM Metrics
DCM includes 22 code metrics across three categories: function-level, class-level, and file-level metrics. Each metric provides quantitative insights into your code's complexity, maintainability, and structure.
This guide will walk you through various techniques that will help you choose the right metrics for your project.
Always remember to choose metrics that balance each other as using just one metric is not enough.
For example, using only cyclomatic-complexity can lead to a single complex method being split into tens of smaller simpler methods which kinda addresses the metric, but dealing with a lot of small methods can still be quite difficult. To balance that, enable number-of-methods.
Another example is addressing the number-of-methods since one way to fix it is to merge several methods into one which inevitably makes the new method harder to understand. That's where source-lines-of-code can help.
Start by Analyzing Your Codebase
Before choosing which metrics to enable, run dcm init metrics-preview to see how your codebase currently performs against all available metrics:
$ dcm init metrics-preview lib
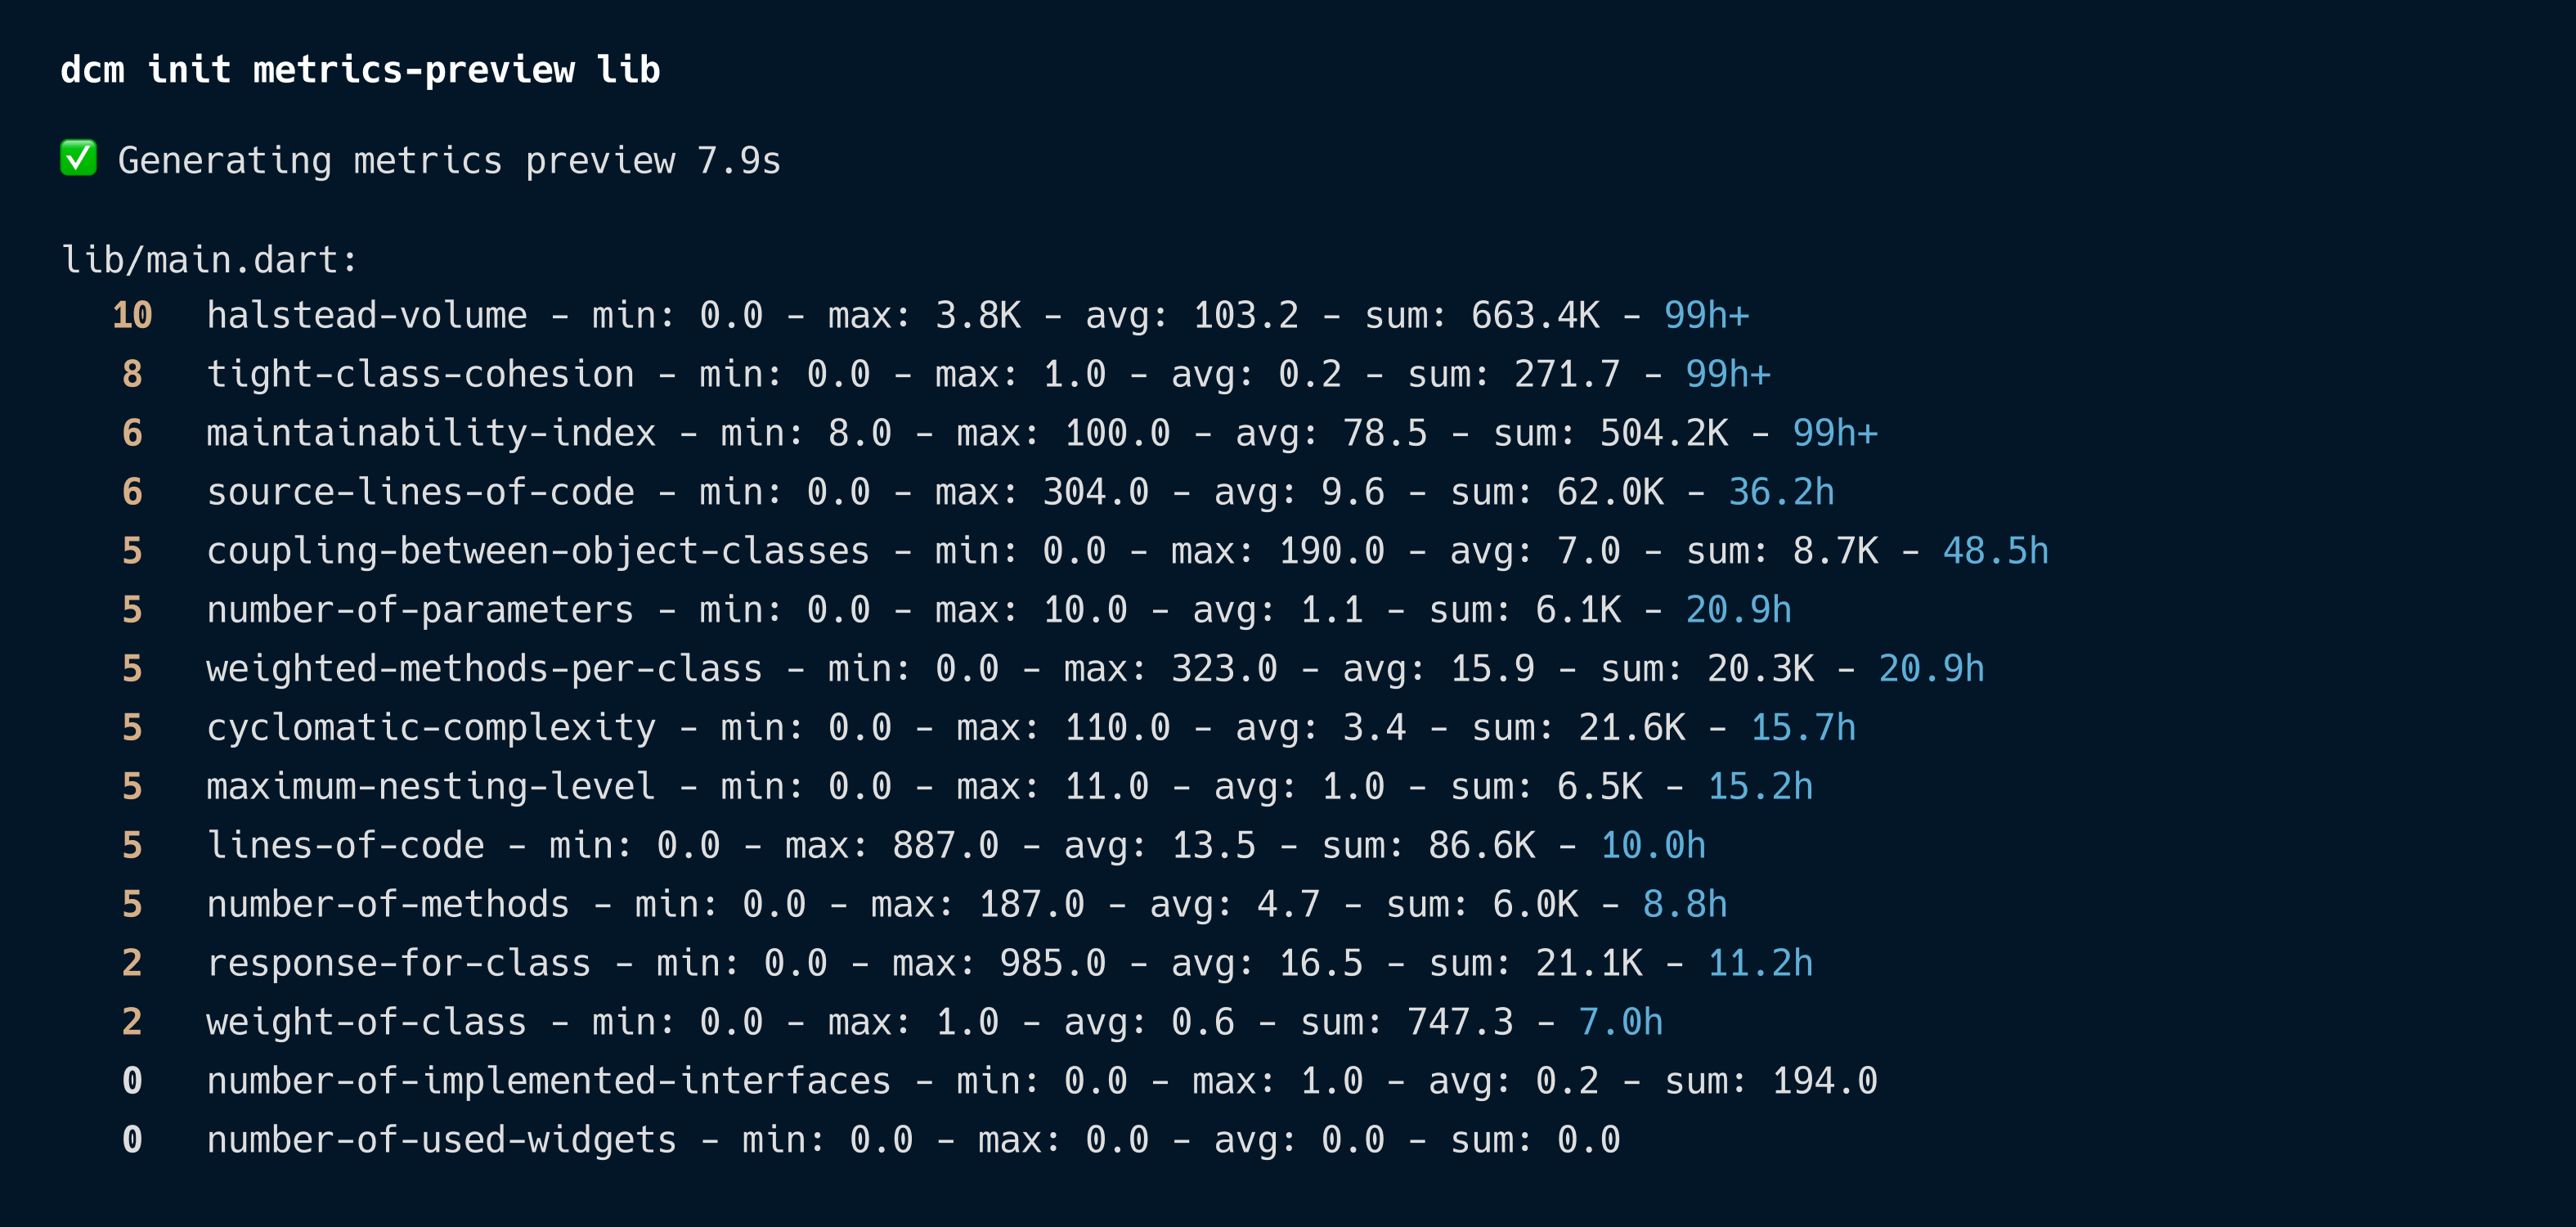
This command shows for each metric:
- The number of violations
- Statistical distribution (min/max/avg),
- Estimated effort to fix issues.
Use this data to make informed decisions about which metrics to enable first.
Use --empty-violations to find metrics with 0 violations, these are easy wins you can enable immediately without any refactoring work.
For more details on output formats and filtering options, see the full command documentation.
Using the "metrics-recommended" Preset
The quickest way to get started is with the "metrics-recommended" preset, a curated set of metrics with sensible default thresholds that focus on the most impactful code quality indicators. This preset is bundled with the tool and requires no additional packages.
To enable it, update your analysis_options.yaml:
dcm:
  extends:
    - metrics-recommended
The preset includes 13 metrics with their default thresholds:
| Category | Metric | Default Threshold |
|---|---|---|
| Function-level | cyclomatic-complexity | 15 |
| source-lines-of-code | 60 | |
| maximum-nesting-level | 5 | |
| number-of-parameters | 6 | |
| number-of-used-widgets | 20 | |
| widgets-nesting-level | 8 | |
| Class-level | coupling-between-object-classes | 20 |
| depth-of-inheritance-tree | 5 | |
| number-of-implemented-interfaces | 3 | |
| number-of-methods | 10 | |
| weighted-methods-per-class | 45 | |
| File-level | number-of-external-imports | 6 |
| number-of-imports | 15 |
To find out more about presets, refer to the documentation on presets.
Adjusting a Preset for Your Needs
If a preset includes metrics with thresholds that don't match your project's needs, you can override them:
dcm:
  extends:
    - metrics-recommended
  metrics:
    cyclomatic-complexity:
      threshold: 20
    source-lines-of-code:
      threshold: 80
Choosing Metrics by Pain Point
Another effective approach is to choose metrics based on specific problems you're experiencing in your codebase.
Complex, Hard-to-Test Code
If your team struggles with testing or understanding complex functions:
- cyclomatic-complexity: identifies functions with too many branches
- maximum-nesting-level: highlights deeply nested code that's hard to follow
- maintainability-index: provides a composite score predicting maintenance difficulty
// High cyclomatic complexity (many branches)
void processOrder(Order order) {
  if (order.isPaid) {
    if (order.hasStock) {
      if (order.isEligibleForDiscount) {
        // More nested conditions...
      }
    }
  }
}
Large Classes With Too Many Responsibilities
If you have "god classes" that do too much:
- number-of-methods: identifies bloated classes
- weighted-methods-per-class: measures overall class complexity
- tight-class-cohesion: detects classes with unrelated responsibilities
Tightly Coupled Code
If changes in one part of the codebase frequently break other parts:
- coupling-between-object-classes: reveals classes dependent on many others
- response-for-class: shows how many methods can be invoked from a class
- number-of-external-imports: helps manage external dependencies
Overly Complex Widget Trees
For Flutter projects with hard-to-maintain UI code:
- widgets-nesting-level: identifies deeply nested widget trees
- number-of-used-widgets: highlights build methods that need splitting
// High widgets nesting level
Widget build(BuildContext context) {
  return Scaffold(
    body: Padding(
      child: Column(
        children: [
          Container(
            child: Row(
              children: [
                Expanded(
                  child: Text('Deeply nested!'),
                ),
              ],
            ),
          ),
        ],
      ),
    ),
  );
}
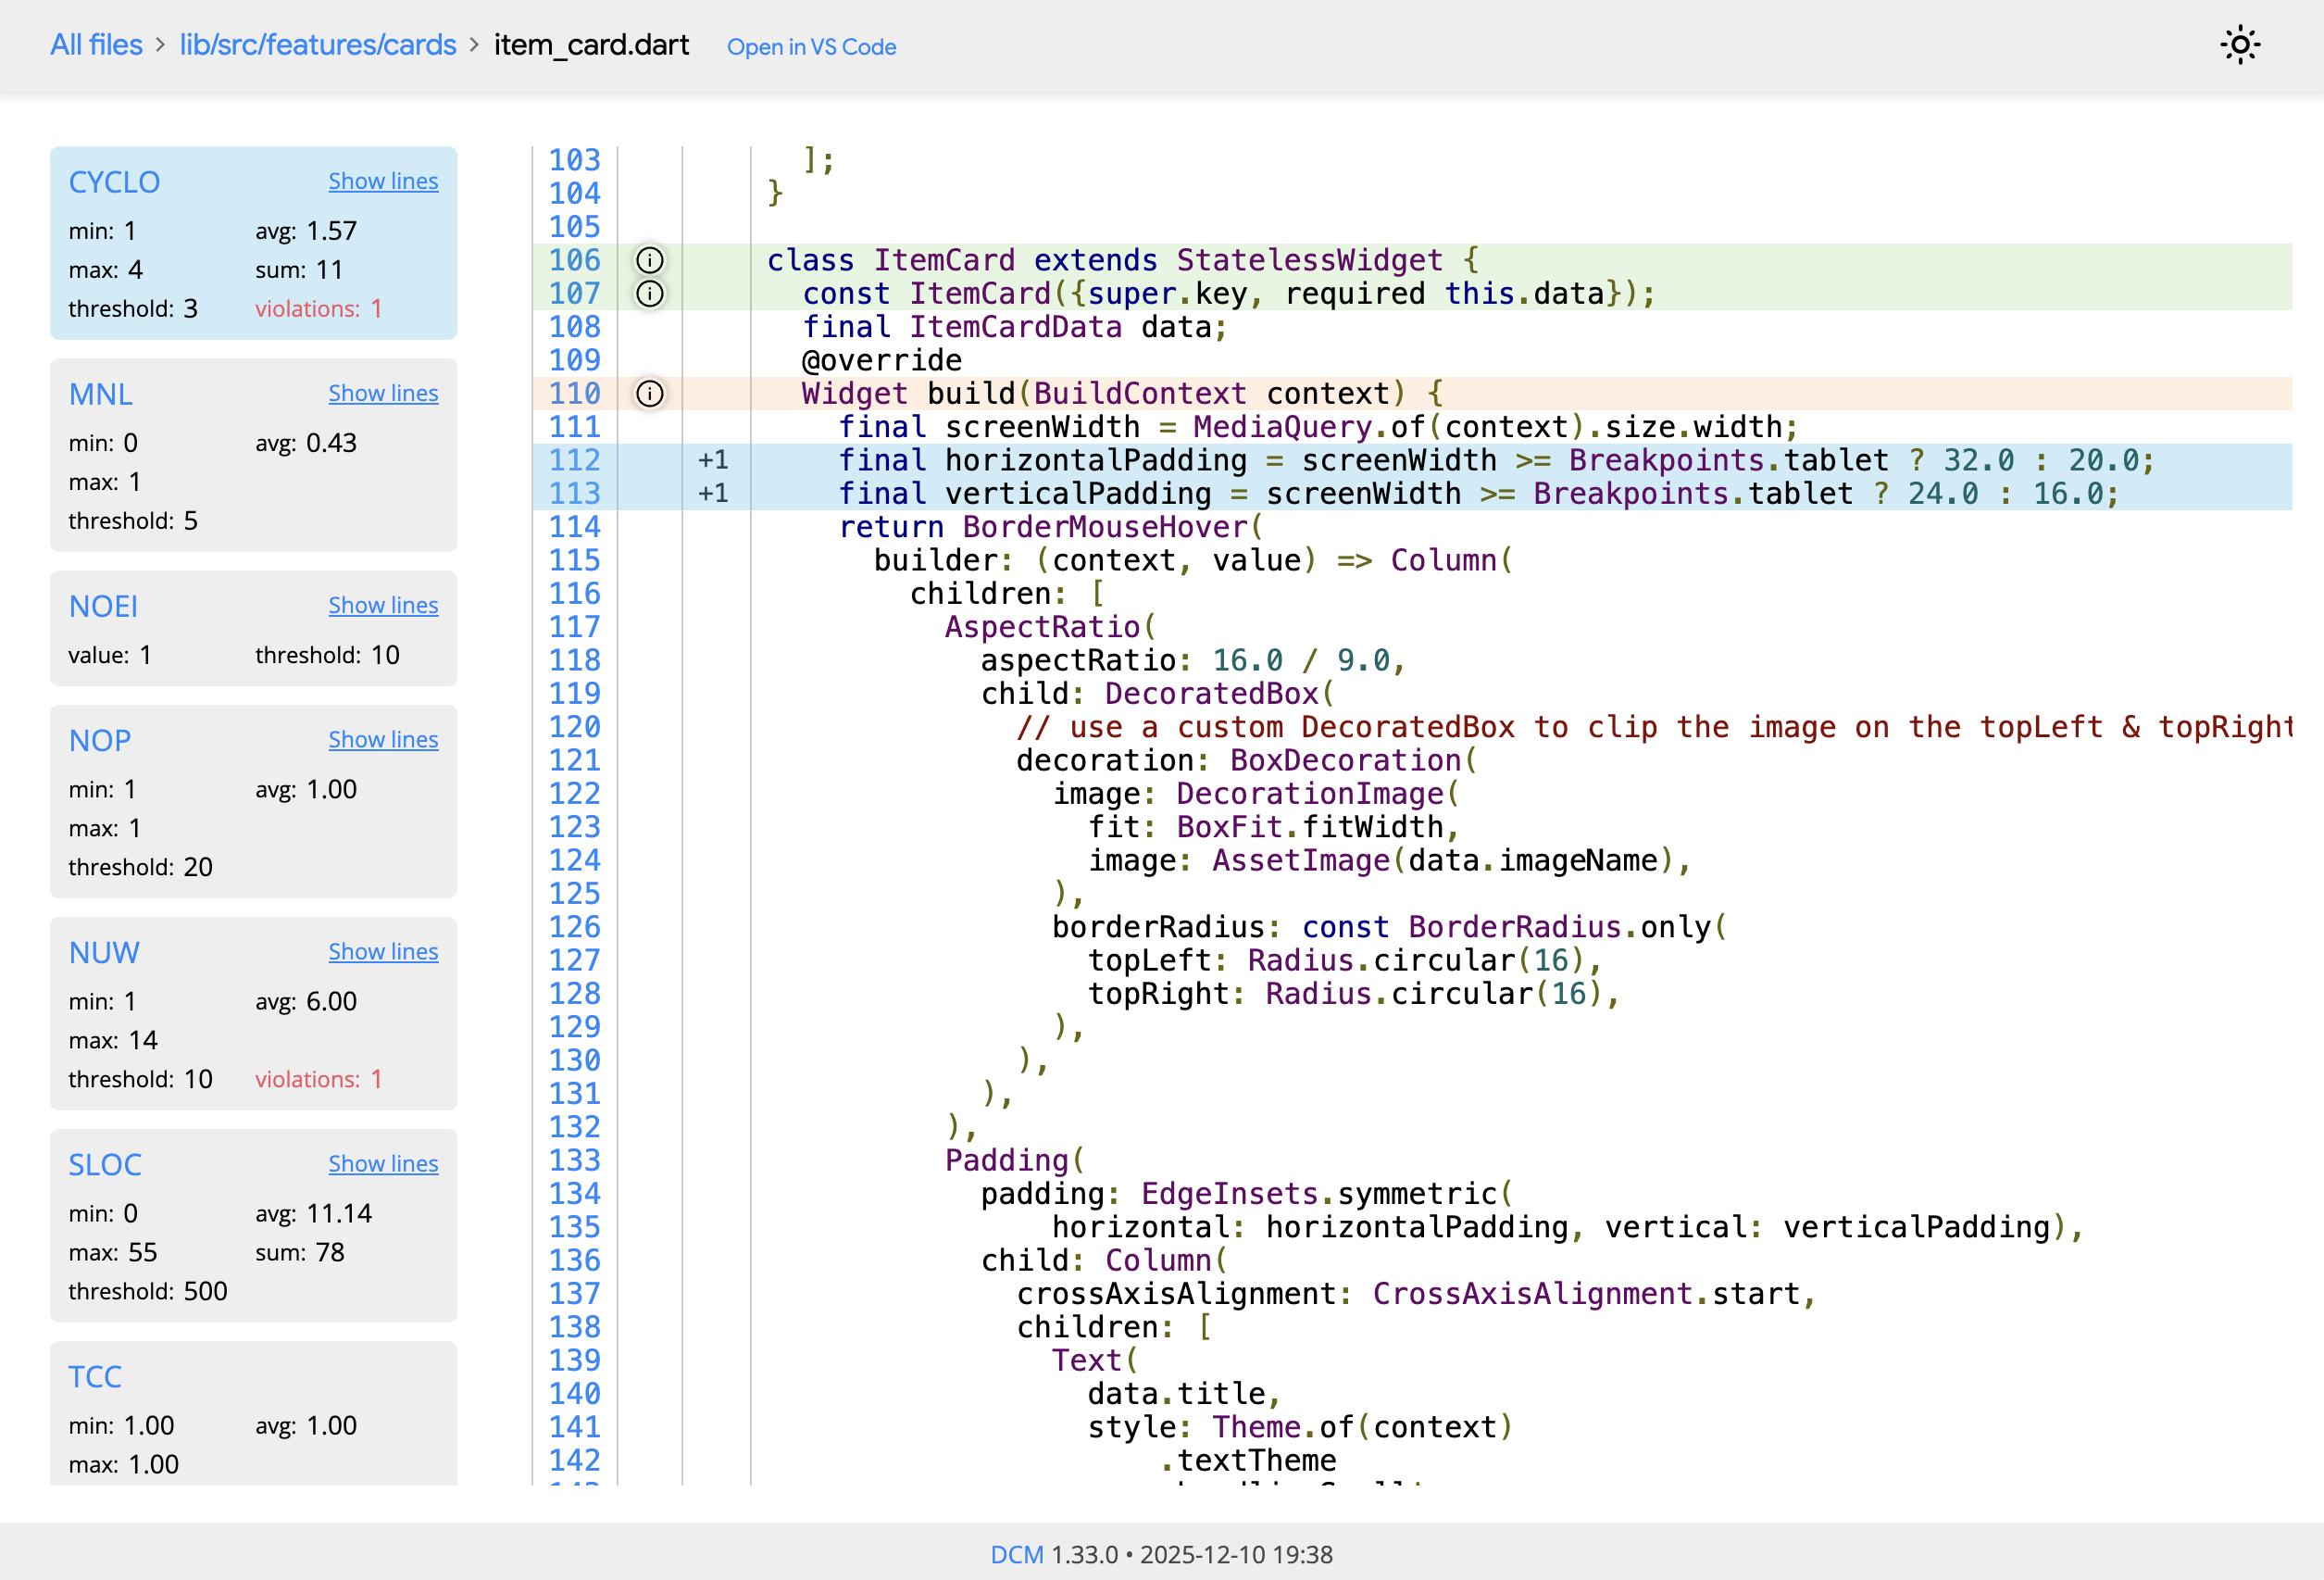
Understanding What Contributes to the Metric Value
When enabling your first set of metrics, it can be very helpful to understand why a particular piece of code is receiving a certain metric value.
To understand which lines affect the metric value, use the HTML output format and navigate to the specific file page. There, use the "Show lines" button.
What's Next
Once you've chosen your first metrics, you may want to explore additional resources:
- Advanced Metrics Configuration: Configure path-specific thresholds for legacy code, team-based standards, and dashboard tracking
- HTML Reports: Generate detailed reports to understand what contributes to each metric value
- DCM Dashboards: Track metrics trends over time and across your team
If you are integrating DCM into an existing project, check out this guide to learn about various techniques for gradual adoption.